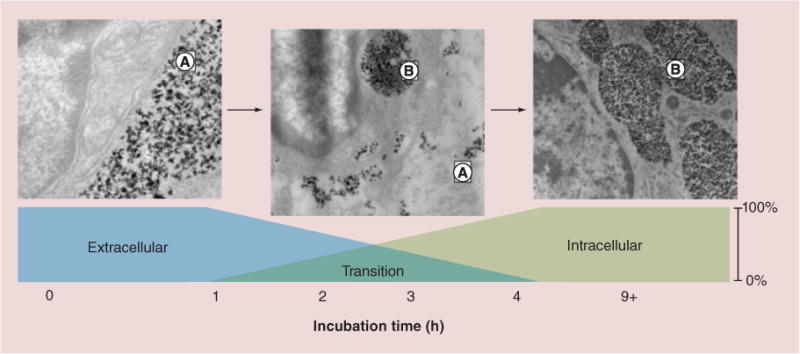
Figure 6. In vivo observation of iron oxide nanoparticle movement.

These figures demonstrate movement of iron oxide nanoparticles from the extracellular location (left figure, A) to semi-aggregated intracellular (A) and extracellular (B) locations (center figure) to entirely intracellular aggregation (right figure, B). The intratumoral postinjection time is indicated [36].
