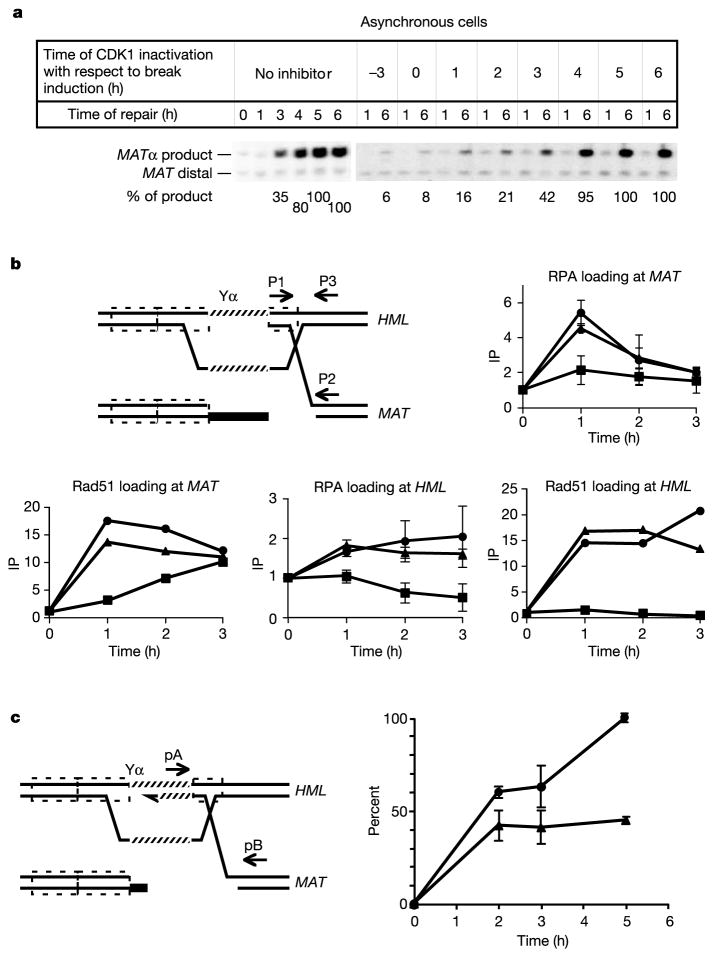
Figure 5.
Role of CDK1 in a late stage of MAT switching. a, Cdc28-as1 was inhibited in cells at different times before and after HO induction, and the amount of product formed at 6 h was determined. b, Strand invasion was tested by ChIP analysis for RPA and Rad51 in a cdc28-as1 strain. The diagram shows homologous sequences (dashed outlined boxes) and primers used to detect immunoprecipitation (IP) of MAT (p1, p2) or HML (p1, p3) with anti-Rad51 or Rfa1 antibodies. Symbols indicate the time at which inhibitor was added with respect to break induction: triangles, no inhibitor; squares, 0.5 h; circles, 1.5 h. c, Polymerase chain reaction detects the first new DNA synthesis primed by the 3 ′ invading end after strand invasion. Circles, no inhibitor; triangles, 1-NMPP1 added 1.5 h after HO induction. Where error bars are shown, results are means ± s.d.

