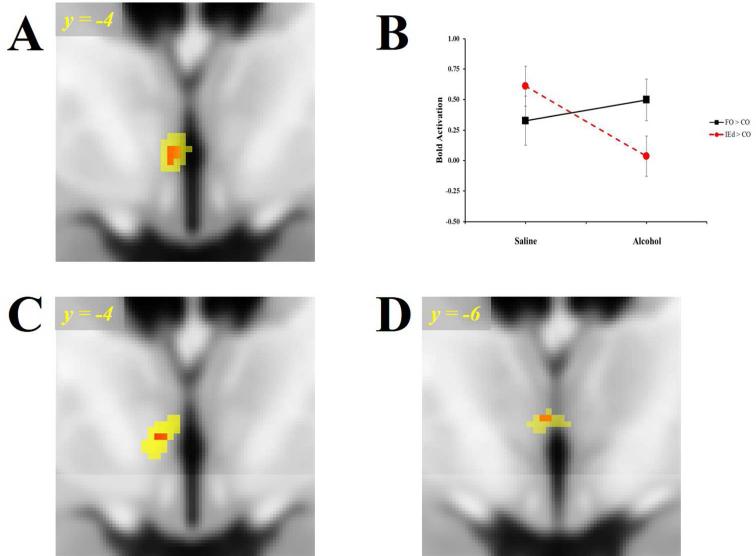
Figure 4.
A.) Alcohol's Effect on Food Odor BOLD Response [FO > IEd] Alcohol > Saline in the hypothalamus for all subjects (n=35). B.) Plots of mean BOLD responses for all subjects occurring within the Saline and Alcohol infusion sessions as extracted from the functional cluster (Table 2; puncorr < 0.005; yellow) in Panel A. C.) Differential Odor Response [FO > IEd]Alcohol in the Hypothalamus in 13 AEM subjects. D.) 3-Way Interaction BOLD Response AEM>AEL [FO > IEd] Alcohol > Saline in the Hypothalamus/Thalamus in 25 subjects. Display threshold, puncorr < 0.005 (yellow), Red color illustrates peak voxel-wise effect, puncorr ≥ 0.001. FO = Food Odors; IEd = Inedible Object Odors; AEM = Alcohol Eat More; AEL = Alcohol Eat Less.

