Figure 5.

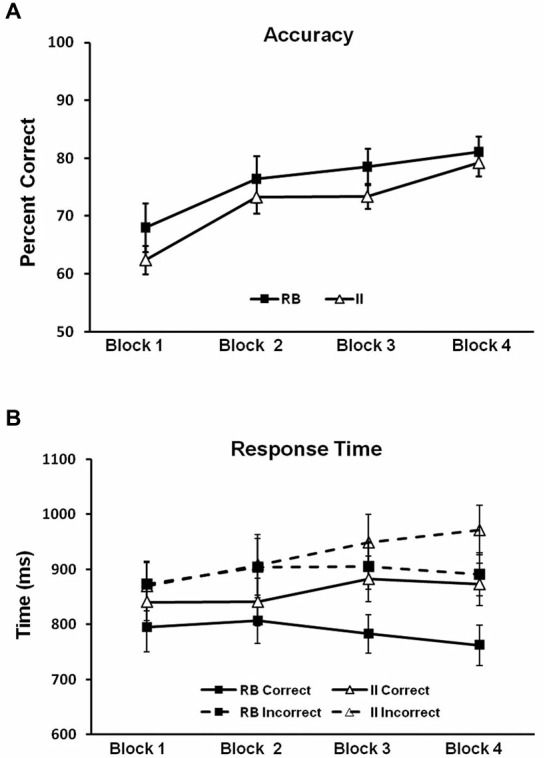
Behavioral results for Model-Conforming Group. (A) Accuracy and (B) RTs for participants included based on DBT model fits and included in the analysis of brain potentials. Error bars represent ±1 standard error of the mean.

Behavioral results for Model-Conforming Group. (A) Accuracy and (B) RTs for participants included based on DBT model fits and included in the analysis of brain potentials. Error bars represent ±1 standard error of the mean.