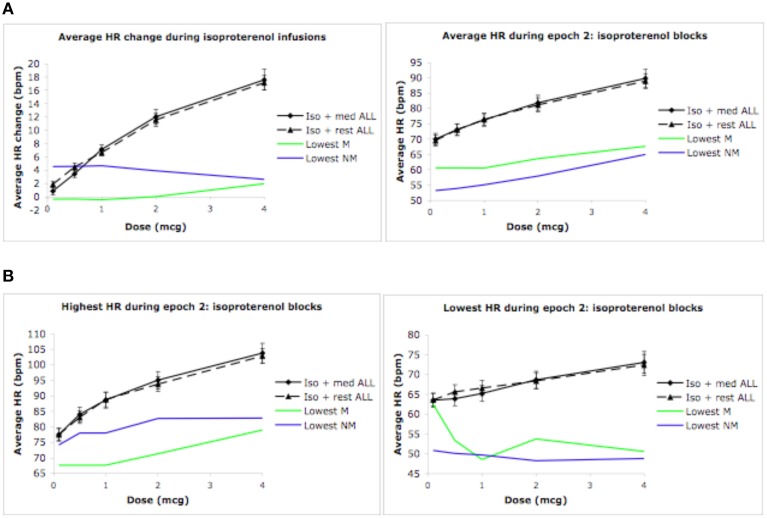
Figure 5.
Global and individual outlier heart rate changes during isoproterenol conditions. (A) Global mean heart rate change (epoch 2 minus epoch 1), and global mean heart rate observed during epoch 2 for all participants. (B) Global maximum heart rate change and global minimum heart rate change observed during epoch 2 for all participants. The green lines indicate the meditator who displayed the lowest response during the isoproterenol plus meditation condition. The blue lines indicate the non-meditators who displayed the lowest response during the isoproterenol plus relaxation condition. For purposes of clarity, the relaxation condition for the non-meditators is labeled as meditation. Error bars represent standard error of the mean.

