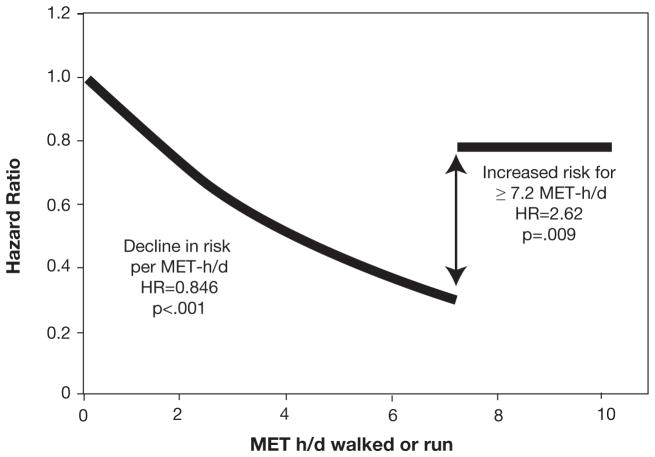
Figure 7.
Continuous model. Cox proportional survival analyses of the risk of CVD-related mortality vs MET-h/d run or walked. In the model “αMET-h/d Trimmed(MET-h/d if MET-h/d≤7.2, 7.2 otherwise) + βIndicator function (1=MET-h/d≥7.2, 0 otherwise) + covariates,” the hypothesis β=0 tests whether the hazard ratio is increased significantly above 7.2 MET-h/d relative to the hazard ratio at 7.2. Shown is the 15.4% average decrease in the risk for CVD-related mortality per MET-h/d between 0 and 7.2 MET-h/d (95% CI, 8.9%–21.5%; P<.001) and a 2.62-fold risk increase above 7.2 MET-h/d relative to the risk at 7.2 MET-h/d (95% CI, 1.29- to 5.06-fold; P=.009). CVD = cardiovascular disease; HR = hazard ratio; MET-h/d = metabolic equivalent of task-h/d. Reproduced with permission from Williams P et al, Mayo Clin Proc).126

