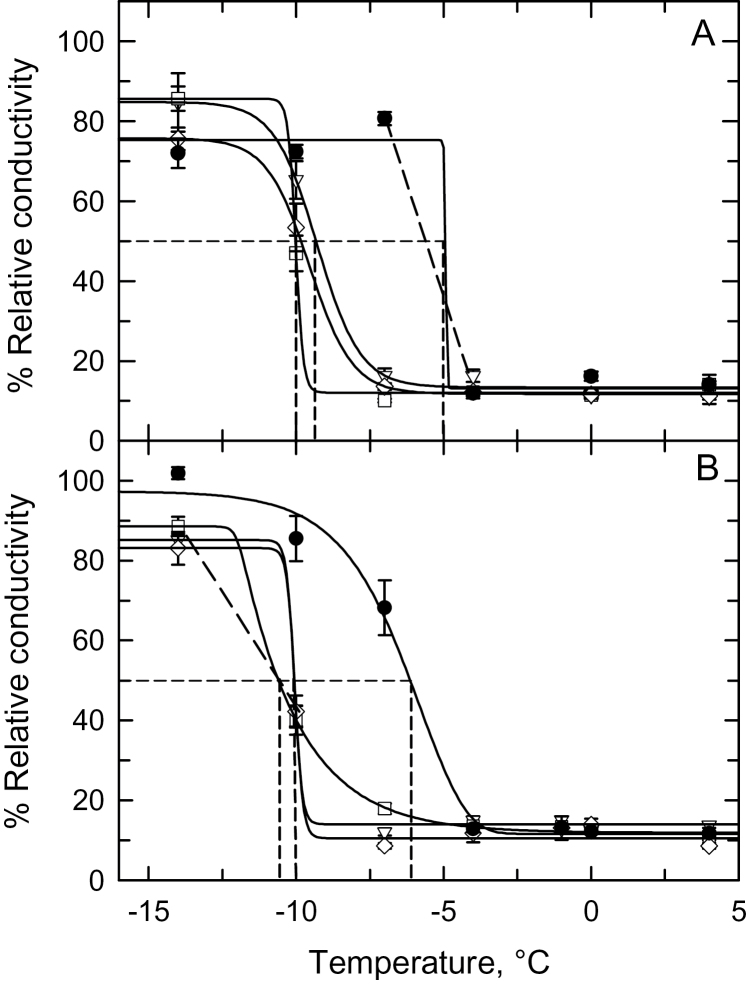
Fig. 5.
The relationship between % relative conductivity and treatment temperature for leaves of Miscanthus × giganteus and the three genotypes of Spartina pectinata on (A) 29 May 2014 harvest and (B) 25 June 2014. Miscanthus × giganteus (●); S. pectinata accessions: ‘Red River’ (∆), ‘IL-102’ (□), ‘Summerford’ (◊). Mean ±SE, n=9–12 per treatment temperature. Solid curves show the corresponding best-fit logistic regressions. Temperatures corresponding to 50% electrolyte leakage (=50% RC and the TEL50) are indicated by the dashed lines.

