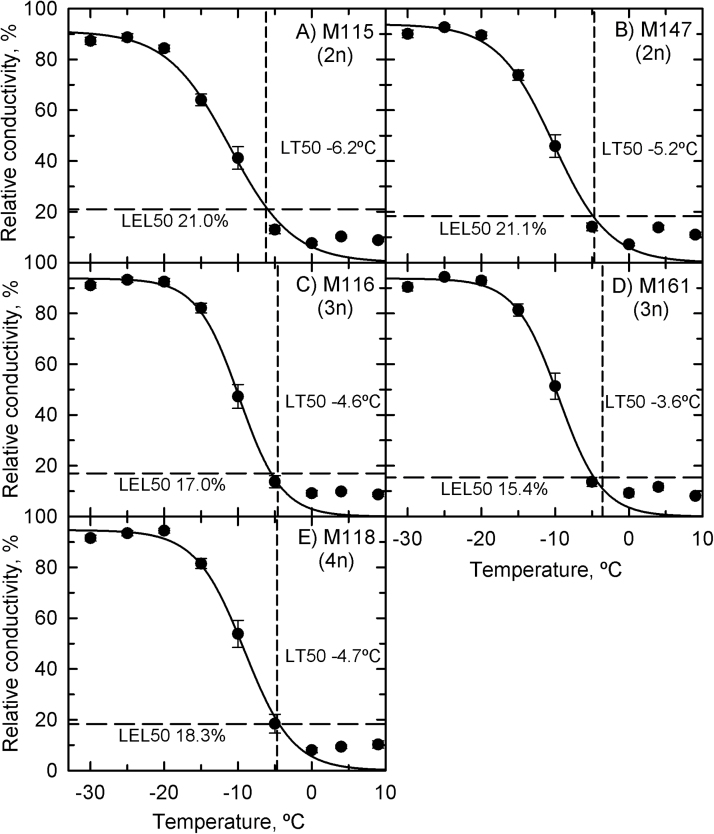
Fig. 5.
Relative conductivity as a function of the lowest temperature at which Miscanthus rhizomes were tested in the continuous-cooling rate experiment. (A) M115; (B) M147; (C) M116; (D) M161; (E) M118. Symbols represent mean±SE (n=18) of the pooled data from all collection times because there was no effect of time (P=0.13) or genotype (P=0.52). The vertical dashed line is the predicted LT50, and horizontal dashed line is the predicted LEL50. The solid line is a logistic regression.

