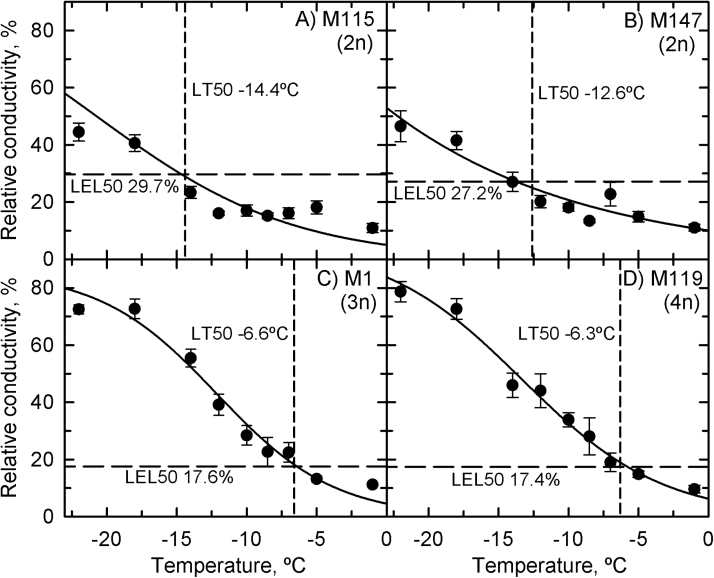
Fig. 8.
Relative conductivity as a function of the treatment temperature in Miscanthus rhizomes from the staged-cooling rate experiment. (A) M115; (B) M147; (C) M1; (D) M119. Symbols represent means±SE (n=12) of the pooled data from all collection times because there was no difference between collection times (P>0.05). Differences between genotypes were significant (P=0.001). The vertical dashed line is the LT50, and the horizontal dashed line is the LEL50. The solid line is a logistic regression.

