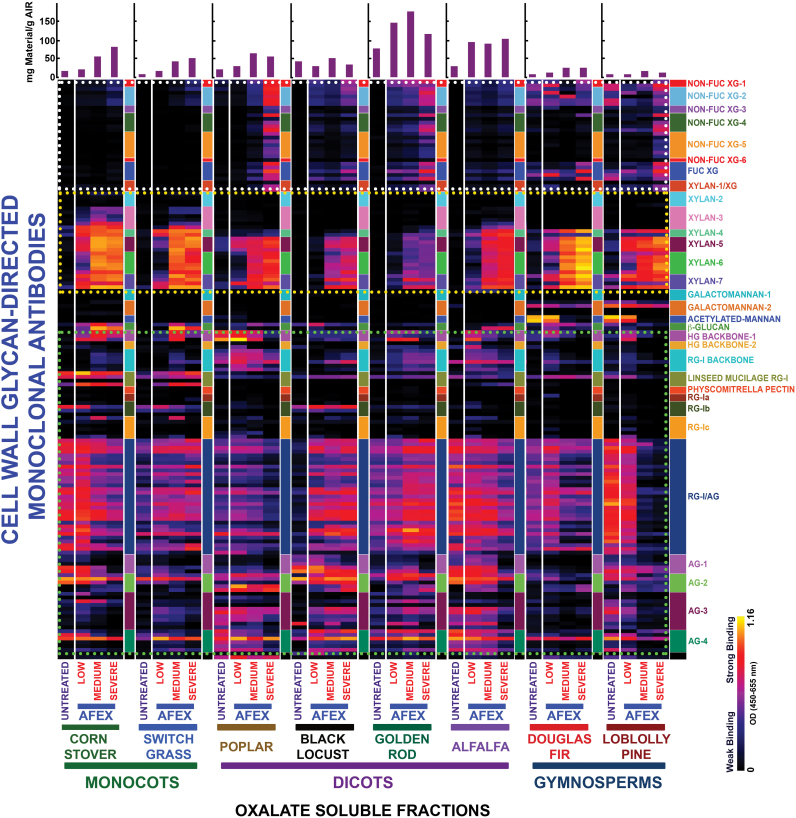
Fig. 1.
Heat map analyses of the relative abundance of major non-cellulosic cell wall glycan epitopes in oxalate extracts from eight phylogenetically diverse plant biomasses with or without AFEX™ pre-treatment. Oxalate extracts were prepared from cell walls isolated from diverse classes of plant biomass as explained in the Materials and Methods. The extracts were subsequently screened by ELISA using a comprehensive suite of cell wall glycan-directed mAbs. Binding response values are depicted as heat maps with a black–red–bright yellow colour scheme, where bright yellow represents the strongest binding and black no binding. The dotted boxes outline sets of antibodies whose binding signals were used for the scatter plot analyses shown in Fig. 2. The amount of carbohydrate material recovered per gram of cell wall is depicted in the bar graphs (purple) above the heat maps. The panel on the right-hand side of the heat map shows the groups of mAbs based on the class of cell wall glycan they each recognize.

