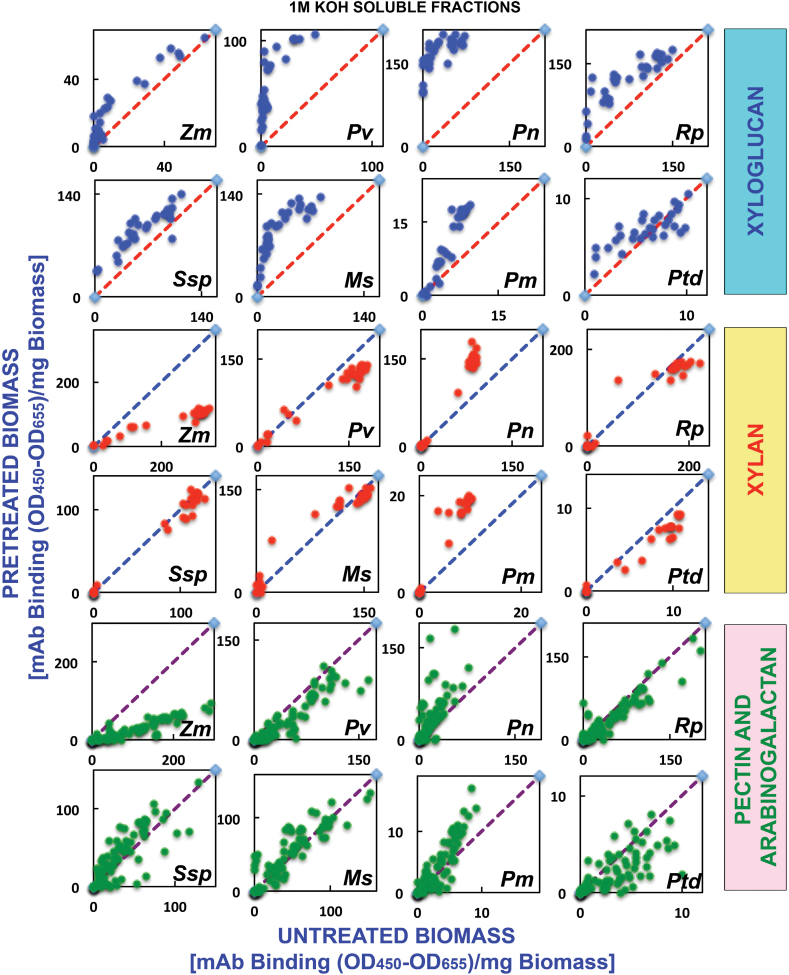
Fig. 6.
Scatter plot analyses of the relative abundance of major non-cellulosic cell wall glycan epitopes in 1M KOH extracts from eight phylogenetically diverse plant biomasses with or without AFEX™ pre-treatment. The 1M KOH extracts were prepared from cell walls isolated from diverse classes of plant biomass as explained in the Materials and Methods. The extracts were subsequently screened by ELISA using a comprehensive suite of cell wall glycan-directed mAbs. Comparisons of the relative abundances of epitopes characteristic of three cell wall polysaccharide classes, xyloglucans (blue dots), xylans (red dots), and pectin/arabinogalactans (green dots), in the 1 M KOH extracts before and after medium severity AFEX™ pre-treatment of diverse plant biomass samples (see Fig. 2 for more details). Data are re-plotted from Fig. 5, but are normalized to represent mAb binding strength per mass of original cell wall. The red dashed lines denote the expected position if the abundance of these glycan epitopes was unchanged after AFEX™ pre-treatment. Data points above and below the dashed lines represent increased or decreased glycan epitope abundance, respectively, after AFEX™ pre-treatment. Note that the y-axis scales are different for individual plots to permit visualization of trends and magnitudes of normalized epitope abundances.

