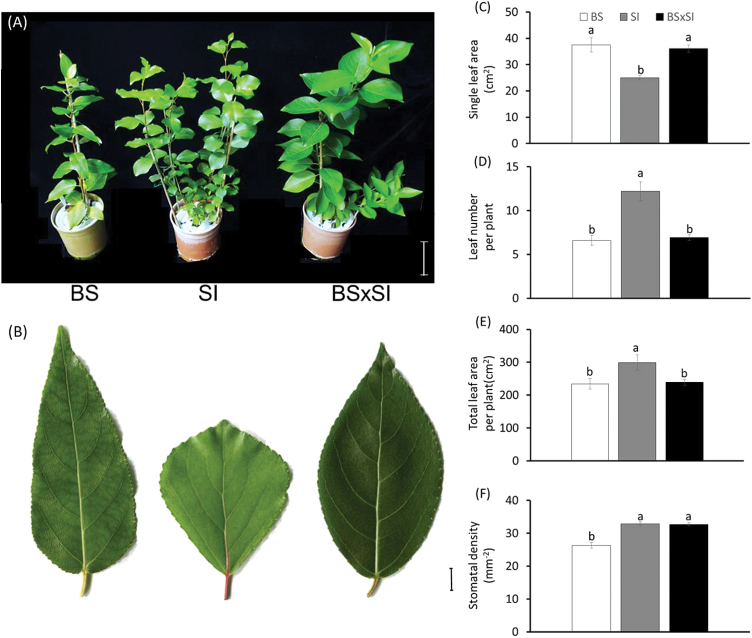
Fig. 3.
Canopy and leaf morphology characteristics of the three poplars genotypes: (A) image of representative 5-month-old seedlings grown in a semi-controlled greenhouse and used for the experiments (bar = 10cm); (B) representative fully mature, expanded leaves (bar = 1cm); (C) single leaf area; (D) leaf number per plant; (E) total canopy area per plant; and (F) stomatal density in a 1mm2 sample area. Data are shown as means ± SE; BS (n = 14), SI (n = 18), BSxSI (n = 34). Different letters above the columns indicate significant differences between treatments using Tukey’s HSD test, P < 0.05 (this figure is available in colour at JXB online).

