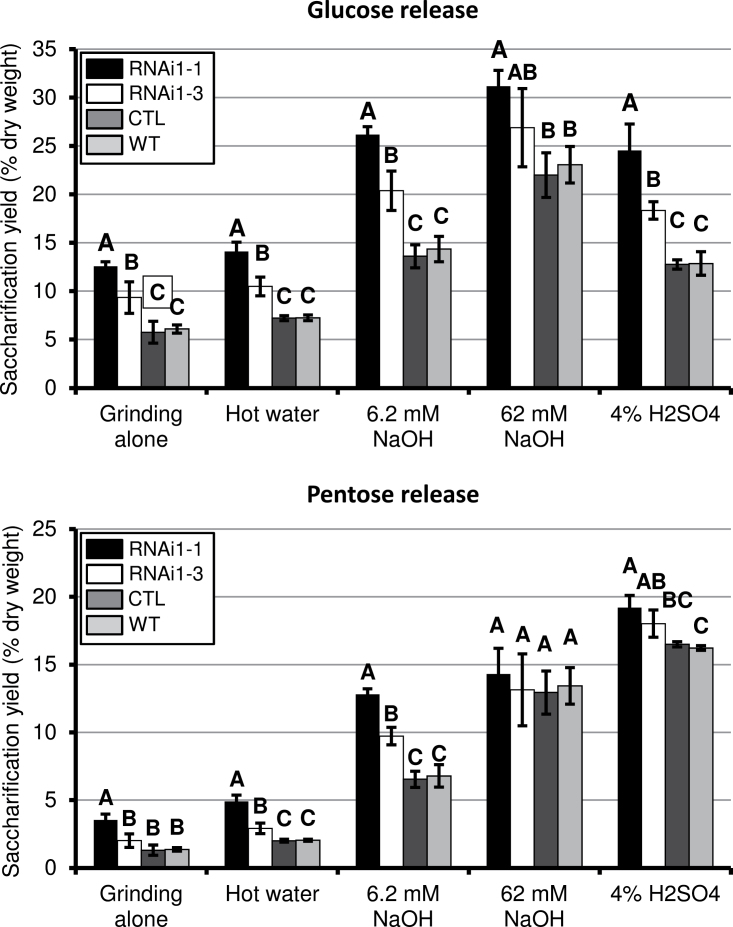
Fig. 2.
Digestibility of stem biomass, comparing BdPAL RNAi1-1 and 1-3 with empty vector control (CTL) and the WT. Shown are the average amounts of glucose (top chart) and pentose sugars (bottom chart) released per milligram of senesced ground biomass using the various pre-treatments along with partial enzyme hydrolysis. Vertical bars represent the SD. Different letters for a given treatment represent significant differences. n=5 biological reps, n=3 technical reps.

