Fig. 1.

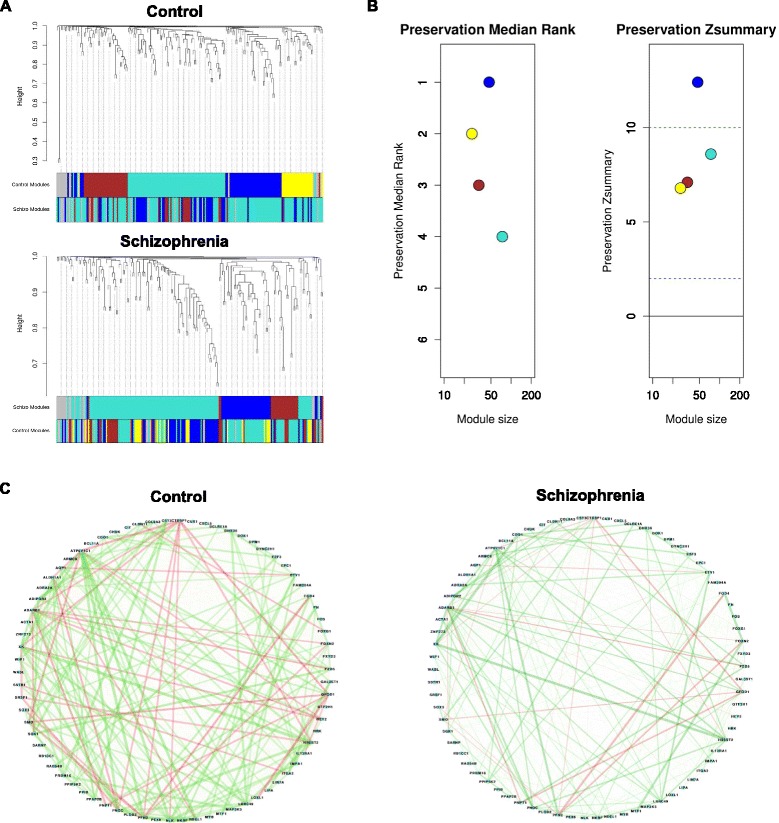
Module preservation analysis. a Dendrograms produced by average hierarchical clustering using topological overlapping matrix dissimilarity. Colours represent different modules. Upper panel shows modules in control subjects (CTS; blue, brown, yellow and turquoise) compared to patients with schizophrenia (SZP). Lower panel shows modules in patients with schizophrenia (blue, brown and turquoise) compared to modules in control subjects. b Left panel shows the median preservation rank (y-axis) in relation to module size (x-axis). Each circle represents a module labelled in different colours (blue, turquoise, yellow and brown). Right panel shows the Zsummary (y-axis) in function of module size. Dashed lines represent thresholds 2 and 10: ≥10: high preservation; 2 < Zsummary <10: moderate preservation; <2: low preservation. The panels show that the blue module is more preserved in control and patients whilst the turquoise module is less preserved. c Connectivity patterns (correlation network adjacencies) between genes from the turquoise module in controls (control) and patients (schizophrenia) showing a large loss of connectivity among genes in patient’s module compared to control modules. Line thickness represents the connectivity pattern and line colour reflects the absolute correlation: −1 (negative) to 1 (positive). This module is enriched in genes related to response to negative regulation of cell differentiation and oxidative stress
