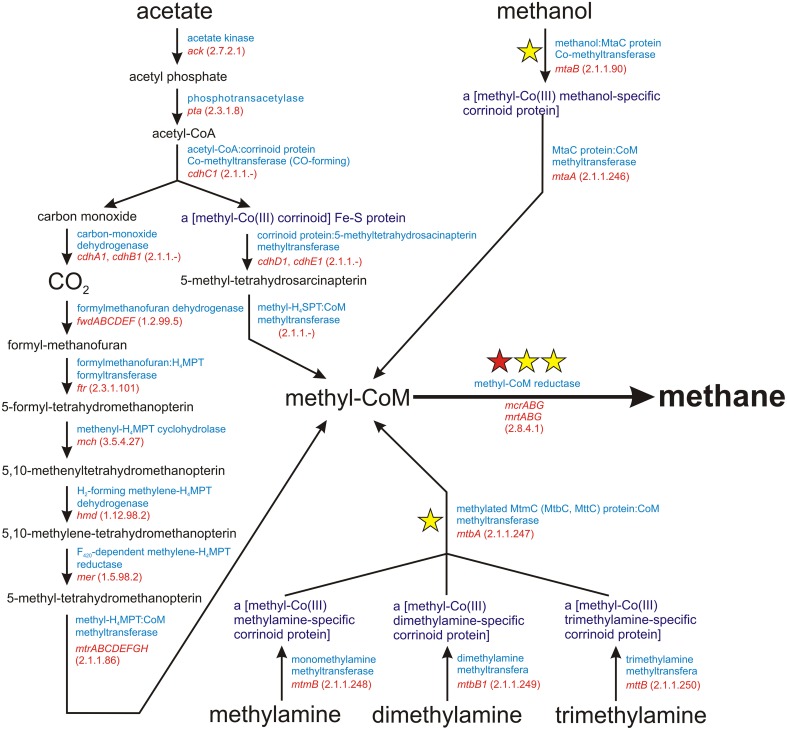
Figure 1.
Schematic diagram of the superpathway of methanogenesis. E.C. numbers for particular enzymes are shown in parentheses. The red star indicates the mcrA gene encoding subunit α of a methyl-coenzyme M reductase I, which is commonly used as a molecular marker for the detection of methanogens. The yellow stars denote molecular markers developed in this study, for which sets of PCR primers were designed.

