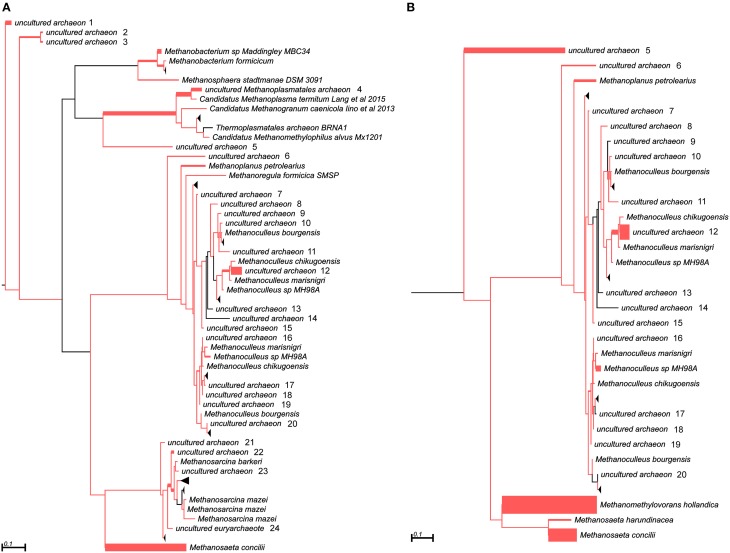
Figure 3.
Phylogenetic placement of mcrA amplicons from AD (A) and WD (B) samples. The width of the red branches corresponds to the number of unique mcrA amplicon sequence reads in that particular branch (this can be either a leaf or node). The collapse of some branches (mapped to uncultured archaeons) to increase the clarity of the trees is indicated by a black triangle. Numbers next to the entries “uncultured archeon” indicate the same microorganism on both trees.

