Fig. 8.
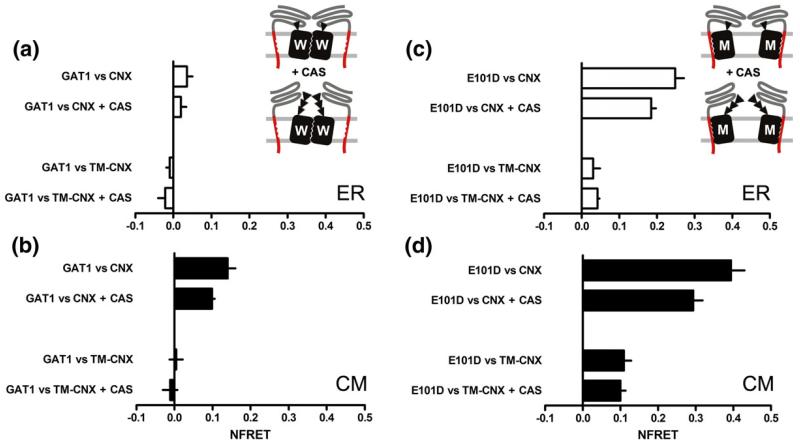
FRET analysis of co-expressed transporter/chaperone pairs. (a–d) HEK293 cells were co-transfected with the indicated plasmids. Images were captured by the three-filter method and the analysis was performed as described in the legend for Fig. 3d–f and under Materials and Methods to calculate the NFRET. Data represent means±SEM from two to five experiments; the numbers below correspond to numbers of experiments for each bar, from top down, in the indicated panels of Fig. 6: (a and b) 5, 5, 4, 3; (c and d) 3, 2, 4, 3. Each experiment included 18 separate determinations per FRET pair. The sketch for (a) and (b) illustrates the interaction between wild-type GAT1 and calnexin (CNX); pretreatment with castanospermine (1 mM, CAS) abolished the interaction with the lectin domain of calnexin. The sketch for (c) and (d) shows that pretreatment with castanospermine (1 mM, CAS) did not prevent sustained glycan-independent interactions with calnexin, including those mediated by the intramembrane portions of the interacting proteins. Data sets obtained from images of ROIs in the diffuse ER (indicated “ER” in a and c) and from ROI in the concentric membrane structures (indicated “CM” in b and d).

