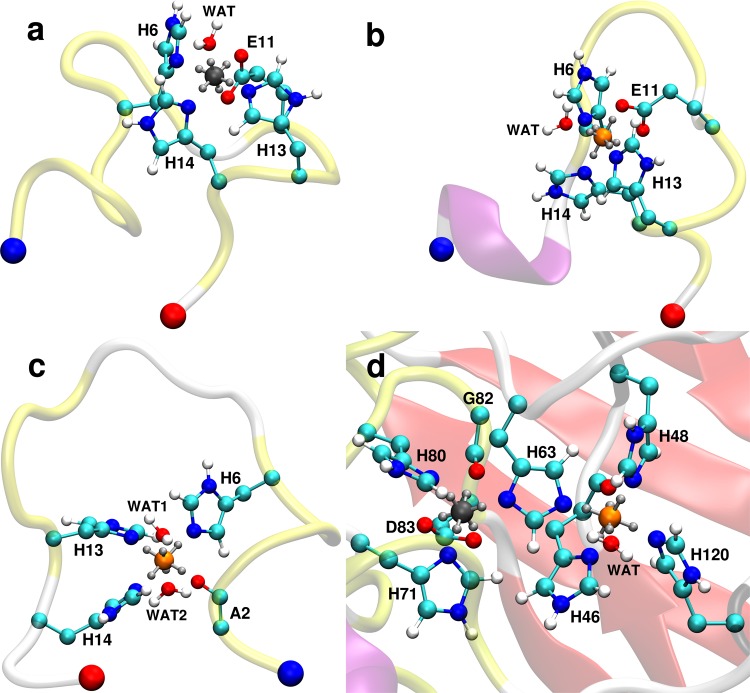
Figure 2.
Final snapshots of dummy models in protein systems taken from 100 ns MD simulations of (a) Aβ1–16E11/ZnDum, (b) Aβ1–16/CuDum, (c) Aβ1–16A2/CuDum, and (d) CuZnSOD/ZnDum/CuDum. The proteins are shown in cartoon presentation and colored red for β-sheet, purple for 310 helix, yellow for turn, and white for coil. The N- and C-terminus of Aβ1–16 is indicated by a blue and red bead, respectively. The metal binding sites are shown in Corey–Pauling–Koltun (CPK) presentation using turquoise for C, blue for N, red for O, and white for H atoms, while Zn2+ is shown in gray and Cu2+ in orange.

