
Figure 1.
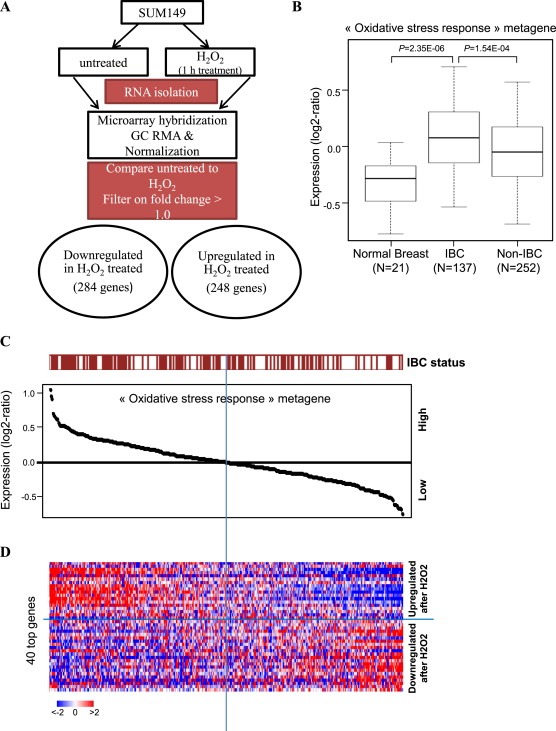
Oxidative stress response signature in IBC clinical samples. A, Schematic of development of oxidative stress response (OSR) metagene in SUM149 cells, comparing untreated to H2O2 administration. B, Expression values of the “oxidative stress response” metagene set generated from H2O2‐treated and untreated SUM149 cells; values are reported as a box plot according to the type of samples (normal breast, IBC, non‐IBC). p‐values are indicated (t‐test). C, Classification of 389 breast cancer samples from left to right based upon decreasing metagene value; the IBC/non‐IBC type is shown above the curve: red for IBC, white for non‐IBC. D, Heatmap showing expression values in BC samples from C for the top 40 genes most differentially expressed. Genes ordered from top to bottom according to decreasing log2‐ratio. Each row represents a gene and each column a sample. Expression levels are depicted according to the color scale at the bottom left, and color saturation represents the magnitude of deviation from the median.