
Figure 5.
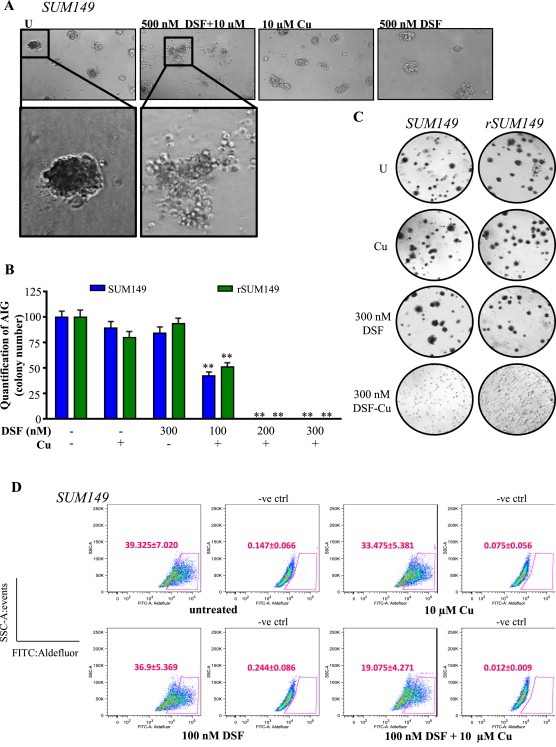
DSF‐Cu inhibits AIG and ALDH activity of IBC cells. A, Representative images of SUM149 mammospheres treated with indicated concentrations. Magnification: 10× inset: 20×. B, Quantification of AIG assay (by colony number) relative to untreated in SUM149 (blue bars) and rSUM149 (green bars) cells treated with DSF, Cu (10 μM), or DSF‐Cu complex. C, Representative AIG images of cells treated as indicated. D, Representative dot‐plots of ALDH1 activity. Cells were incubated with ALDEFLUOR substrate (BAAA), and the specific inhibitor of ALDH1, DEAB, was used to establish the baseline fluorescence and define ALDEFLUOR‐positivity (gated population). DEAB‐treated plots are labeled as –ve ctrl. Mean ± SEM of four independent experiments. Inset, Labeling of X and Y axes.