
Fig. 1.
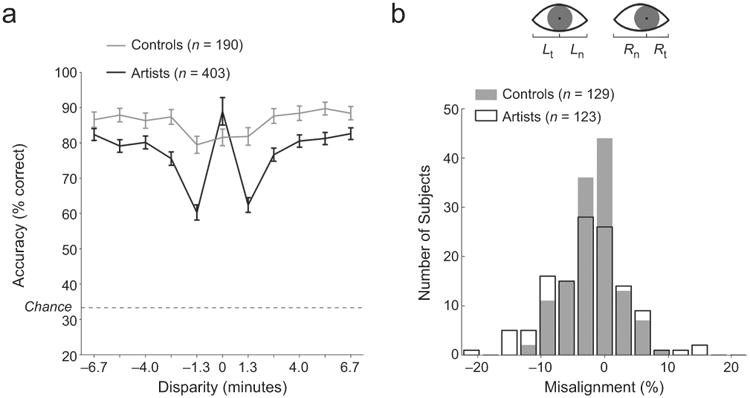
Results from (a) Experiment 1 and (b) Experiment 2. The graph in (a) shows accuracy as a function of disparity of the stimuli for art students and nonartist control subjects. The dotted line indicates chance performance, and error bars represent standard errors of the population averages. The graph in (b) shows the distribution of values of eye misalignment as measured from photographs of established artists and nonartist control subjects. Interocular alignment was measured from the relative position of the irises within the two eyes in photographs of the subjects (top of graph; for an explanation, see the text).