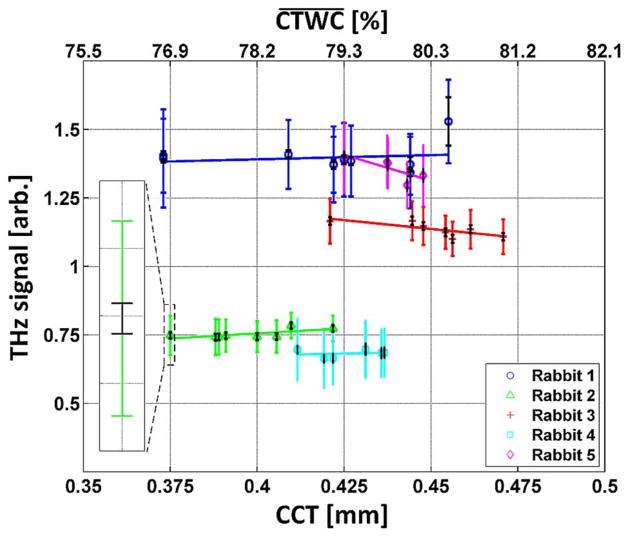
Fig. 10.
THz reflectivities computed with the indicated region of interest as a function of acquired CCT measurements reflected in the lower x-axis. The corresponding CTWC increases predicted by CCT theory are displayed on the top x-axis. A zoom-in of the first point in the rabbit 4 series is displayed in the inset demonstrating the difference in variation between estimated system noise and contrast observed in the 5 mm diameter FOV.

