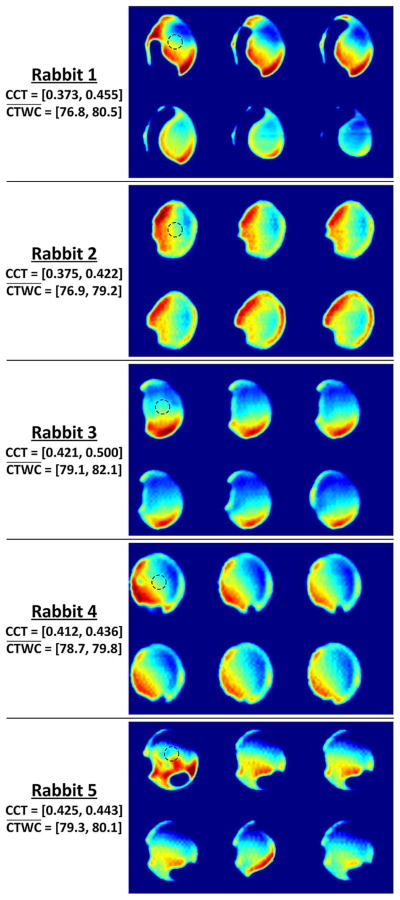
Fig. 9.
Selected THz reflectivity maps of CTWC for all five rabbit models. Each image series is accompanied by its CCT range and computed CTWC levels using (3) Time increases, from left to right and top to bottom for each image series. The dotted circles overlaid on the top left cornea of each image denote the ultrasound probe location.

