
Fig. 1.
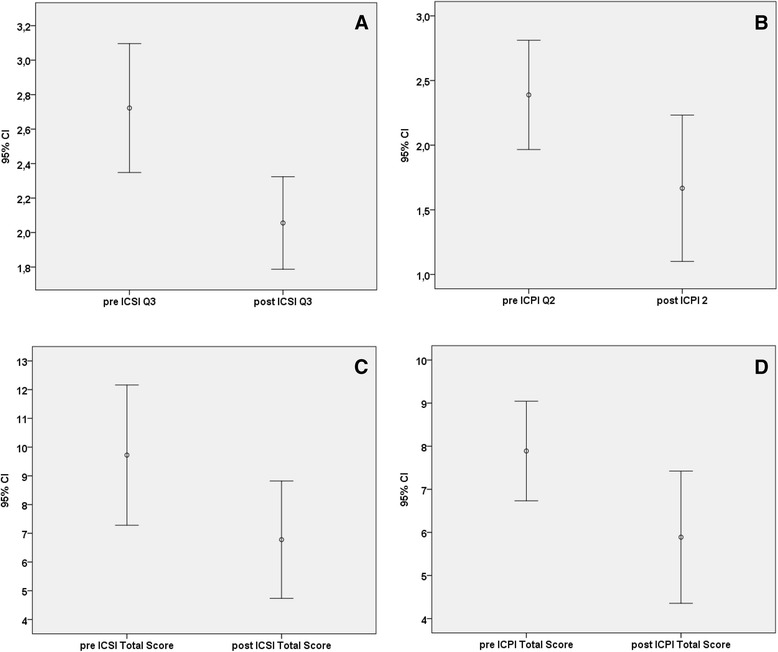
Pre and post treatment mean value of ICSI-Q3 (a), ICPI-Q2 (b), ICSI Total score (c) and ICPI Total score (d). Bars represent 95 % confidence intervals. The relative adjusted and level of significance (p) are reported in the text
Official websites use .gov
A
.gov website belongs to an official
government organization in the United States.
Secure .gov websites use HTTPS
A lock (
) or https:// means you've safely
connected to the .gov website. Share sensitive
information only on official, secure websites.
Pre and post treatment mean value of ICSI-Q3 (a), ICPI-Q2 (b), ICSI Total score (c) and ICPI Total score (d). Bars represent 95 % confidence intervals. The relative adjusted and level of significance (p) are reported in the text