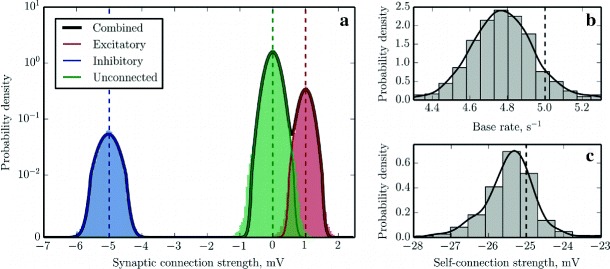
Fig. 3.

Reconstruction of a random balanced network of GLM neurons. The reconstruction was performed for τ=20 ms, d=1.5 ms and d s=0.1 ms. a Gaussian Mixture Model fit for the probability density function of the elements of the reconstructed synaptic weight matrix J (black solid curve) and individual components contributed by excitatory (red solid curve, 〈J e〉=1.004 mV), inhibitory (blue solid curve, 〈J i〉=−5.023 mV) and null (green solid curve, 〈J Ø〉=−0.002 mV) connections. For comparison, we plot as histograms of n=200 bins the distributions of the reconstructed synaptic weights, partitioned into three classes and colored according to whether the corresponding entry in the ground truth connectivity matrix was J Ø=0 mV (unconnected; green), J e=1 mV (excitatory; red) or J i=−5 mV (inhibitory; blue). A perfect reconstruction would result in delta peaks at the three synaptic strength values of the original connectivity matrix, marked with red, blue and green dashed vertical lines. The scale of the vertical axis is logarithmic, except for the first decade, which is in linear scale. b, c Distributions of the identified base rates of the neurons and weights of the self-connections approximated with histograms and Gaussian KDEs. Black dashed vertical lines mark the ground truth values which should have been recovered (c=5 s−1 and J s=−25 mV respectively)
