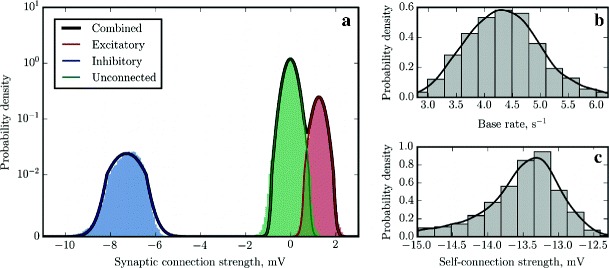
Fig. 5.

Reconstruction of a random balanced network of LIF neurons with α-shaped PSCs. The reconstruction was performed for τ=10 ms, d=1.7 ms (obtained through cross-validation) and d s=0.1 ms. a GMM fit for the PDF of the reconstructed synaptic weight matrix (black solid curve) and individual components (colored solid lines); colored bars under the curves show the distributions of the reconstructed synaptic weights classified using the ground truth synaptic connectivity matrix as in Fig. 3, approximated as histograms of n=200 bins. The scale of the vertical axis is logarithmic, except for the first decade, which is in linear scale. b, c Histograms and Gaussian KDEs approximating the PDFs of the base rates and self-connection weights
