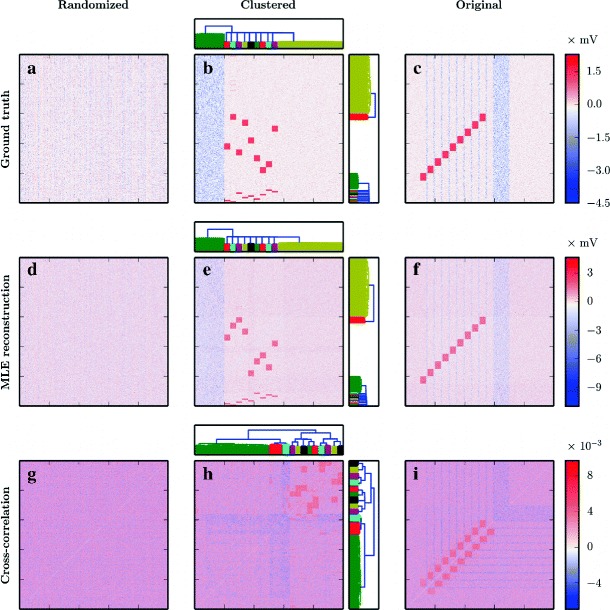
Fig. 9.

Identification of an embedded synfire chain by clustering connectivity estimated from “background” spiking activity. The grouping by rows delineates the panels produced on the basis of the ground truth connectivity, connections estimated using the GLM model, and lagged cross-correlation data. The grouping by columns lays out the panels presenting the connectivity matrices where the order of the neuron identifiers have been randomized, recovered by clustering and defined by the sequence in which the neurons were originally wired up. a, d, g Ground truth and MLE reconstructed synaptic weights, as well as lagged cross-correlation coefficient matrices for randomized neuron identifier order. c, f The red rectangles correspond to the connections from one chain link to the next. Thin blue bands identify inhibitory neurons that belong to the synfire chain. The wide blue band corresponds to the inhibitory neurons that are not part of the chain. b, e The interpretation of the bigger red rectangles and the wide blue band is the same as above, except that all inhibitory neurons are now grouped together. The thin red rectangles at the bottom correspond to the groups of inhibitory neurons in the synfire chain receiving incoming connections from all excitatory neurons in the previous link. The clustering process that produced the reordering and the dendrograms is illustrated in steps in Fig. 8. g, h, i The lagged cross-correlation matrix is symmetric by construction. Therefore, the dendrograms at the top and on the right of panel h are identical (unlike b, e). Diagonal entries (all 1) were excluded here.h, i The red rectangles correspond to groups of neurons that exhibit positively correlated firing activity, while inhibitory neurons display negative correlation, marked by the blue bands
