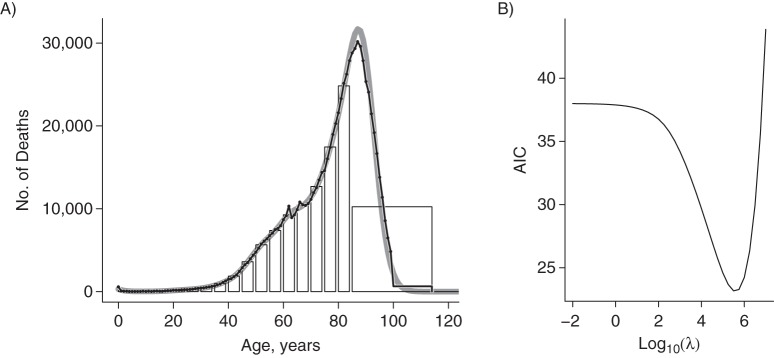
Figure 2.

Ungrouping of the age-at-death distribution for diseases of the circulatory system, United States, 2009. The original data taken from the Centers for Disease Control and Prevention database were grouped in 5-year bins plus a wide class for ages ≥85 years. An additional bin with 0 counts between ages 115 and 130 years was added. This histogram was ungrouped by the penalized composite link model. A) Grouped histogram, original data (black line with overplotted points) and ungrouped data (solid gray line). B) The value of the smoothing parameter λ was chosen by minimizing Akaike's Information Criterion (AIC); λ varied on a fine grid, and the value that gave the minimum of AIC led to log10(λ) = 5.5.
