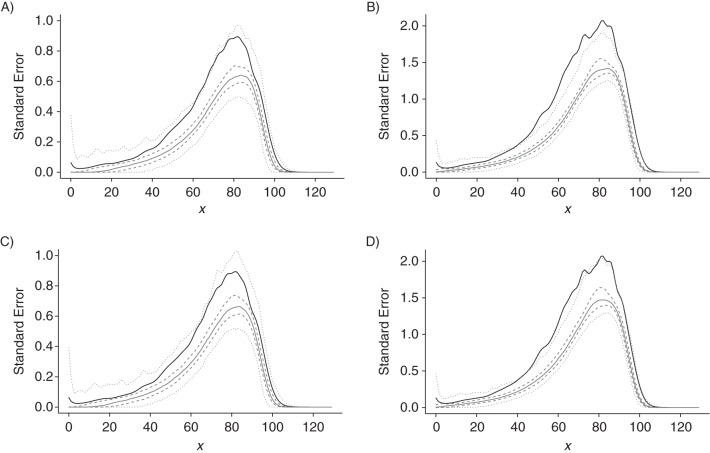
Appendix Figure 1.
Gompertz distribution with grouping width 5 and sample size (A and C, n = 200; B and D, n = 1,000). The solid black line gives the standard deviation of 500 penalized composite link model estimates obtained in this setting. The gray lines summarize the distribution of the 500 estimates of the standard error derived from the sandwich estimator (A and B) and from the Bayesian estimator (C and D), with median (solid gray line), 25%–75% quantiles (dashed gray lines), and 1%–99% quantiles (dotted gray lines), respectively.

