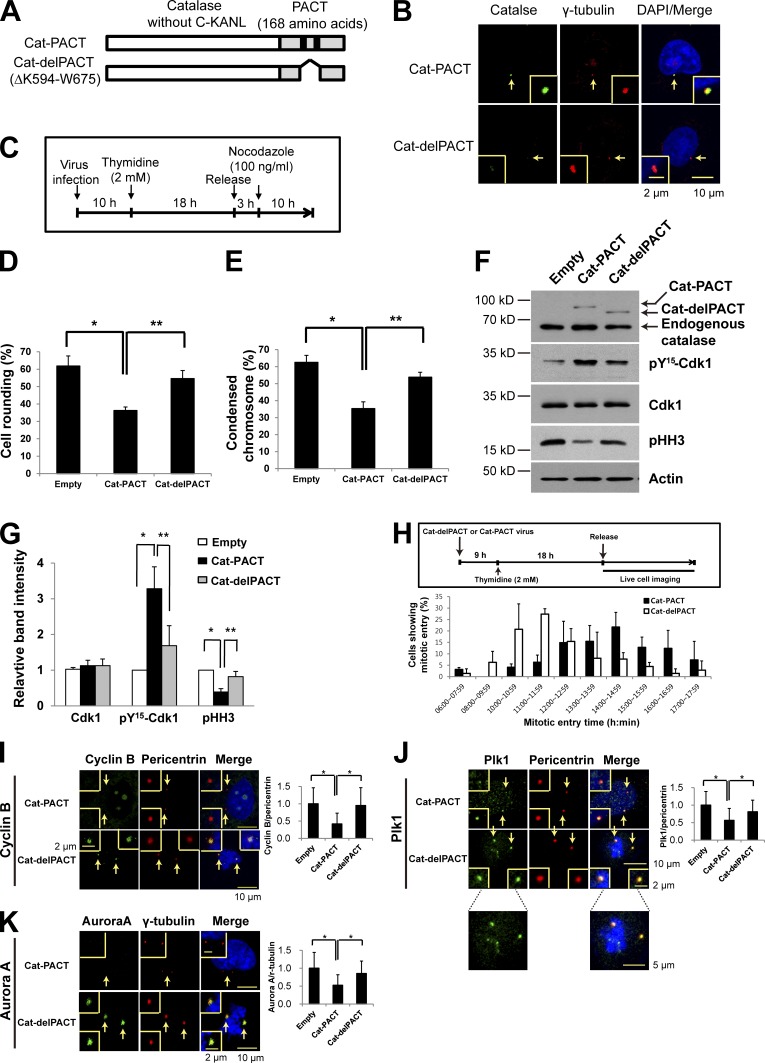
Figure 2.
Effects of centrosome-targeted catalase on mitotic entry and on the abundance of centrosome-associated mitotic regulatory proteins. (A) Schematic representation of Cat-PACT (in which the centrosome-targeting PACT sequence replaces the C-terminal peroxisome-targeting sequence KANL of catalase) and Cat-delPACT (in which the sequence K594 to W675 of Cat-PACT containing two domains [black boxes] essential for centrosome targeting is deleted). (B) HeLa cells infected with a retroviral vector (pMIN) encoding Cat-PACT or Cat-delPACT were subjected to confocal immunofluorescence microscopy with antibodies to catalase (green) and to γ-tubulin (red). DNA was also stained with DAPI (blue). The area indicated by the arrows (centrosome) is shown at higher magnification in each inset. (C–G) HeLa cells stably expressing GFP-tagged histone H2B were infected with empty, Cat-PACT, or Cat-delPACT retroviral vectors for 10 h in the presence of 6 µg/ml polybrene, treated with (2 mM thymidine) for 18 h, released in fresh medium for 3 h, and then treated with 100 ng/ml nocodazole for 10 h (C). The percentage of mitotic cells was then evaluated on the basis of cell rounding (D) or chromosome condensation (E). Data are means ± SD from three independent experiments (n = 50 cells examined for each experiment). *, P < 0.02; **, P < 0.01 (Student’s t test). The cells were also subjected to immunoblot analysis with antibodies to the indicated proteins (F). The relative immunoblot intensities of Cdk1, pY15-Cdk1, and pHH3 normalized by those of actin were also determined as means ± SD from three independent experiments (G). *, P < 0.05; **, P < 0.005 (Student’s t test). (H) HeLa cells expressing histone H2B-GFP were infected with Cat-PACT or Cat-delPACT retroviral vectors, synchronized at G1–S, and released in fresh medium for live-cell imaging. The proportion of cells exhibiting mitotic entry was estimated from Videos 1 and 2 that were acquired over 20 h at 30-min intervals. Data are means ± SD from three independent experiments (n = 90 or 70 cells examined in each experiment for Cat-PACT or Cat-delPACT, respectively). (I–K) HeLa cells infected with empty, Cat-PACT, or Cat-delPACT retroviral vectors were treated as in C and then subjected to confocal microscopy with antibodies to cyclin B1 (green) and to pericentrin (red; I), to Plk1 (green) and to pericentrin (red; J), or to Aurora A (green) and to γ-tubulin (red; K). The relative fluorescence intensity ratios of cyclin B1 to pericentrin (I), of Plk1 to pericentrin (J), and of Aurora A to γ-tubulin (K) were also evaluated at the centrosome. The areas indicated by the arrows are shown at higher magnification in the insets. Data are means ± SD from three independent experiments (n = 50 cells examined for each experiment). *, P < 0.02 (Student’s t test).

