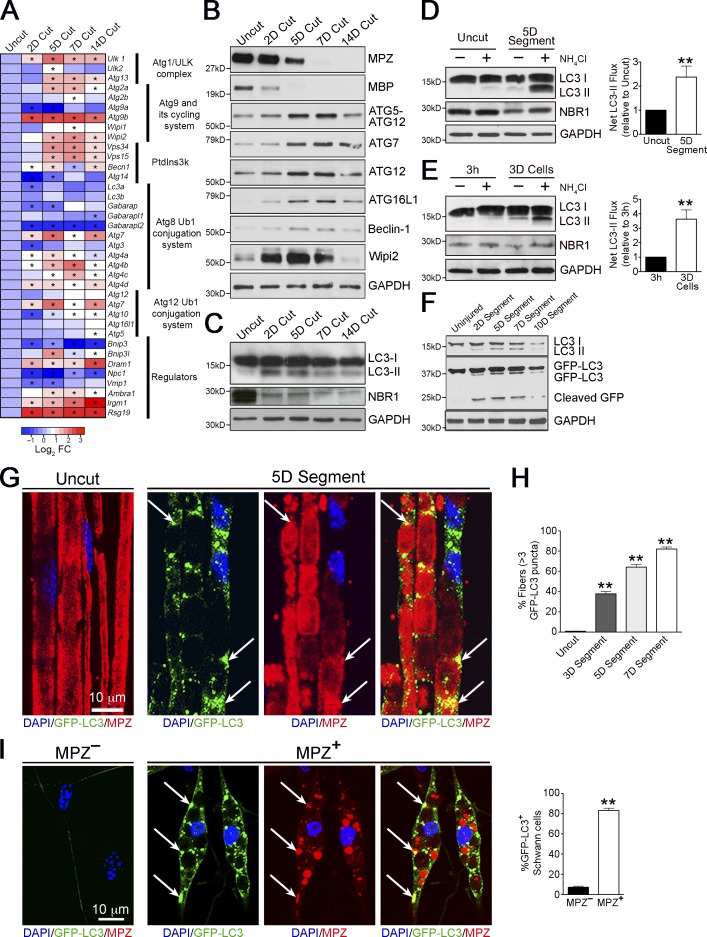
Figure 1.
Autophagy is activated during Wallerian degeneration. (A) Heat map showing qPCR analysis of changes in expression of autophagy-related genes in cut nerves in vivo at different time points (e.g., 2D Cut = 2 d after nerve cut) relative to control uncut nerves. Data are expressed as log2 fold change relative to uncut nerves (red-blue color scale). Significant changes (P < 0.05) are denoted by asterisks within the heat map. Bar graphs depicting fold changes of all the genes examined are shown in Fig. S1. (B and C) Western blotting showing expression of selected autophagy-related proteins (B), and LC3 (LC3-I, 18 kD; LC3-II, 16 kD) and NBR1 (C), in uncut nerves and cut nerves in vivo at different time points. Myelin proteins MPZ and MBP are used as controls to show demyelination after nerve cut. GAPDH is used as a loading control. Quantification of Western blots is shown in Fig. S2, A and B, respectively. (D and E) Western blots showing that LC3-II and NBR1 accumulate after a 3-h treatment with the lysosomal blocker NH4Cl in nerve segments maintained in vitro (D), and dissociated Schwann cell cultures (E). Graphs show significantly higher net LC3-II flux (D) in demyelinating nerves (5 d in vitro [5D]) compared with freshly isolated nerves (Uncut), and demyelinating Schwann cells (E) cultured for 3 d (3D) compared with freshly plated cells cultured for 3 h (3h). Data are presented as mean ± SEM (error bars) from a minimum of three independent experiments. **, P < 0.01. A quantification of NBR1 levels is shown in Fig. S2 (C and D). (F) Western blots showing expression of endogenous LC3 and GFP-LC3 in nerve segments from GFP-LC3 mice maintained in vitro at different time points. Cleaved GFP bands demonstrate a transient increase in autophagic flux after nerve injury. Quantification of Western blots is shown in Fig. S2 E. (G–I) GFP-LC3 puncta in nerves from GFP-LC3 mice. (G) The immunolabeled micrographs show the accumulation of GFP-LC3 puncta in teased nerve segments maintained in vitro for 5 d compared with control teased uncut nerves. MPZ labels myelin. Individual MPZ and GFP-LC3 labeling for 5D nerve segments are shown to illustrate colocalization of MPZ+ myelin debris and GFP-LC3+ autophagosomes (arrows). (H) Graph shows quantification of fibers positive for GFP-LC3 puncta in nerves cultured for 3, 5, and 7 d. n = 3 mice for each time point. Data are presented as mean ± SEM (error bars). **, P < 0.01 (cultured segments relative to uncut nerves). (I) Immunolabeling showing elevated expression of GFP-LC3 puncta in dissociated Schwann cells degrading myelin, shown by the presence of MPZ+ myelin compared with that seen in MPZ– Schwann cells. Individual MPZ and GFP-LC3 labeling for MPZ+ Schwann cells are shown to illustrate colocalization of MPZ+ myelin debris and GFP-LC3+ autophagosomes (arrows). The graph shows quantification of the number of GFP-LC3+ Schwann cells that are MPZ+ or MPZ–. Data are presented as mean ± SEM (error bars) from a minimum of three independent experiments with a minimum of 60 cells analyzed per experiment. **, P < 0.01 (MPZ+ cells relative to MPZ– cells).

