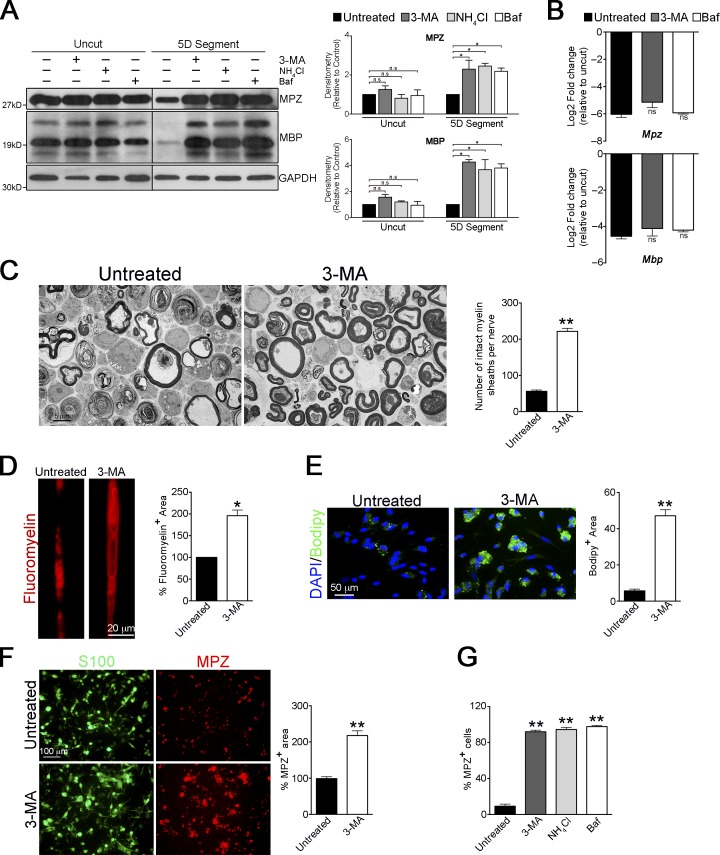
Figure 3.
Pharmacological block of autophagy prevents myelin degradation. (A) Western blot showing a block in degradation of the myelin proteins MPZ and MBP in nerve segments maintained in vitro for 5 d and treated with different pharmacological inhibitors: untreated, lysosomal inhibitor, NH4Cl, and autophagy inhibitors 3-MA and bafilomycin A1 (Baf). No such effect is seen in freshly isolated nerve segments treated with these inhibitors for 3 h. The black line indicates that intervening lanes have been spliced out. Graphs show densitometric quantification of Western blots. Data are presented as mean ± SEM (error bars) from three independent experiments. n.s., nonsignificant; *, P < 0.05. (B) qPCR analysis showing no significant differences (n.s.) in mRNA levels of Mpz and Mbp in nerve segments maintained in vitro for 5 d and treated with 3-MA and Baf, compared with untreated segments. Data are expressed as log2 fold change in 5D cultured nerve segments relative to uncut nerves. n = 3 for each condition. Data are presented as mean ± SEM (error bars). (C) Electron micrographs showing abundant intact myelin sheaths in nerve segments cultured in vitro for 4 d in the presence of 3-MA, compared with untreated cultures. The graph shows a quantification of the number of intact myelin sheaths in untreated segments and segments treated with 3-MA. (D) Teased fibers from untreated and 3-MA treated nerve segments (5 d) stained with FluoroMyelin red. The graph shows a quantification of the myelin fluorescent area. (E) Immunolabeling showing a block in the degradation of lipids (Bodipy+ cells) in dissociated Schwann cell cultures after 3 d of 3-MA treatment. Graph shows quantification of Bodipy+ area. (F) 3-MA blocks myelin protein degradation in dissociated Schwann cell cultures. Immunolabeling showing a block in degradation of MPZ in dissociated Schwann cells (S100+) cultured for 5 d in the presence of 3-MA. The graph shows MPZ+ area in dissociated cultures treated with 3-MA. (G) Graph showing the number of MPZ+ Schwann cells in dissociated cultures treated for 5 d with 3-MA, bafilomycin, and NH4Cl. (C–G) Data are presented as mean ± SEM (error bars) from three independent experiments with a minimum of 10 picture frames analyzed per condition/experiment. *, P < 0.05; **, P < 0.01 (treated cells relative to untreated controls).

