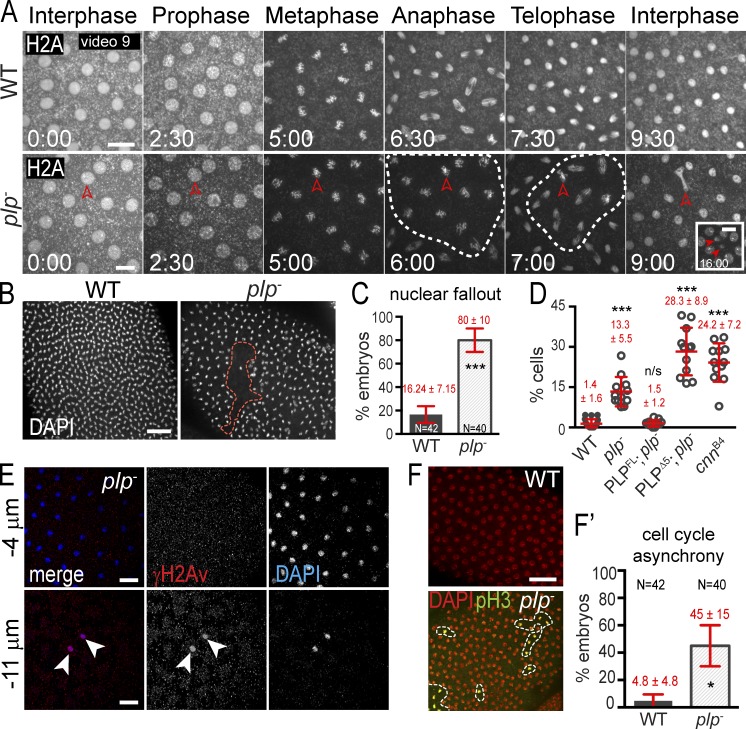
Figure 7.
PLP maintains genome stability. (A) Live H2A-RFP in embryos. Broken circles show mitotic asynchrony. Arrowheads show lagging chromosomes (9:00) followed by NUF (16:00). (B) NUF (broken circle) detected by DAPI. (C and D) The frequency (C) and amount (D) of NUF is quantified. (E) γH2Av (red) labels nuclei (DAPI, blue) ejected from the cortex. Arrowheads show nuclei that have undergone nuclear fallout and stain positive for γ-H2A.The negative sign indicates distance below the embryo surface. (F) Embryos stained with DAPI (red; all nuclei) and pH3 (green; mitotic nuclei) to detect mitotic asynchrony. Results are quantified in F′. Data are mean ± SEM (error bars) for C, all other data are mean ± SD. Time is given in minutes:seconds. *, P < 0.01; ***, P < 0.0001; n.s., not significant. Data shown are from a single representative experiment out of two or more repeats. Bars: (A) 10 µm; (B, E, and F) 20 µm.

