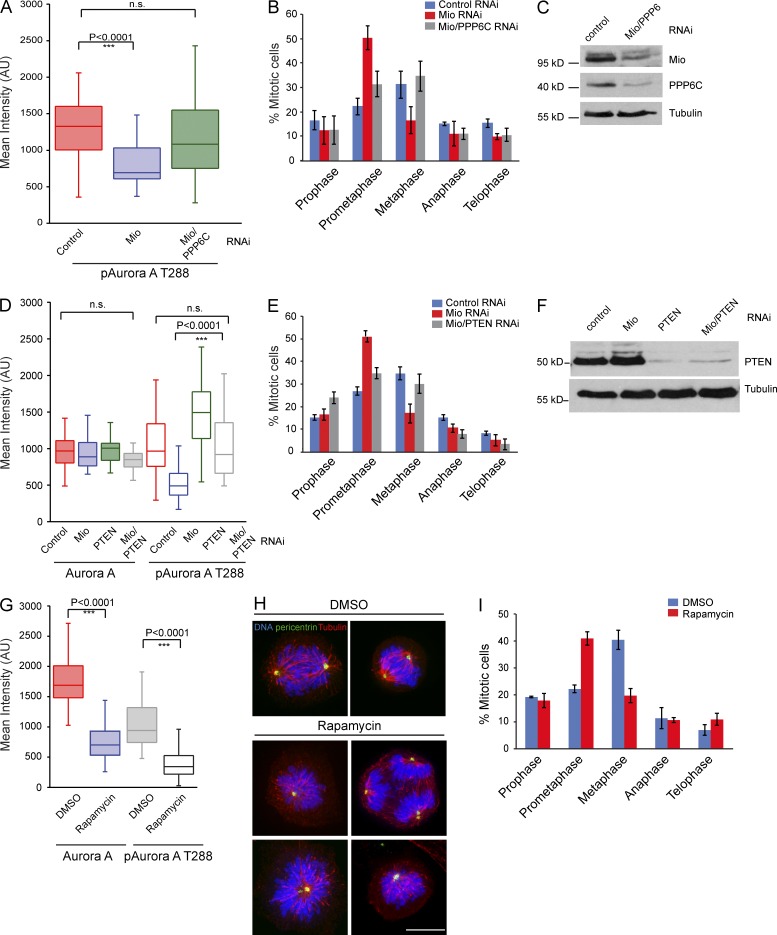
Figure 10.
Activity of mTOR is reduced in mitotic cells after Mio depletion. (A) Quantification of p–Aurora AT288 levels at spindle poles in control, Mio-depleted, and Mio/PPP6C co-depleted cells. (B) Mitotic profile of control, Mio-depleted, and Mio/PPP6C co-depleted cells 48 h after siRNA transfection. 300 cells per condition (n = 3). (C and F) Immunoblots of HeLa cell lysates treated with siRNAs corresponding to negative control, Mio, Mio with PPP6C, PTEN, and Mio/PTEN from asynchronous cells (probed using α-Mio, α-PPP6C, and α-PTEN) show efficient depletion of Mio, PPP6C, and PTEN. Tubulin serves as a loading control. (D) Quantification of Aurora A and p–Aurora AT288 levels at spindle poles in control, Mio-depleted, and Mio/PTEN co-depleted cells. PTEN co-depletion with Mio rescues the p–Aurora AT288 levels reduction. (E) Mitotic profile of control, Mio-depleted, and Mio and PTEN co-depleted cells 48 h after siRNA transfection. 300 cells per condition (n = 3). (G) Quantification of Aurora A and p–Aurora AT288 levels at spindle poles in control DMSO- and rapamycin-treated cells. (A, D, and G) Fluorescence intensities are in arbitrary units (AU). (H) Control DMSO- and rapamycin-treated cells were fixed and immunostained with α-pericentrin (green), α-tubulin (red), and DNA (blue). (I) Mitotic profile of control DMSO- and rapamycin-treated cells after 4-h incubation ( n = 3). Error bars represent SD. n.s., not significant. Bar, 10 µm.

