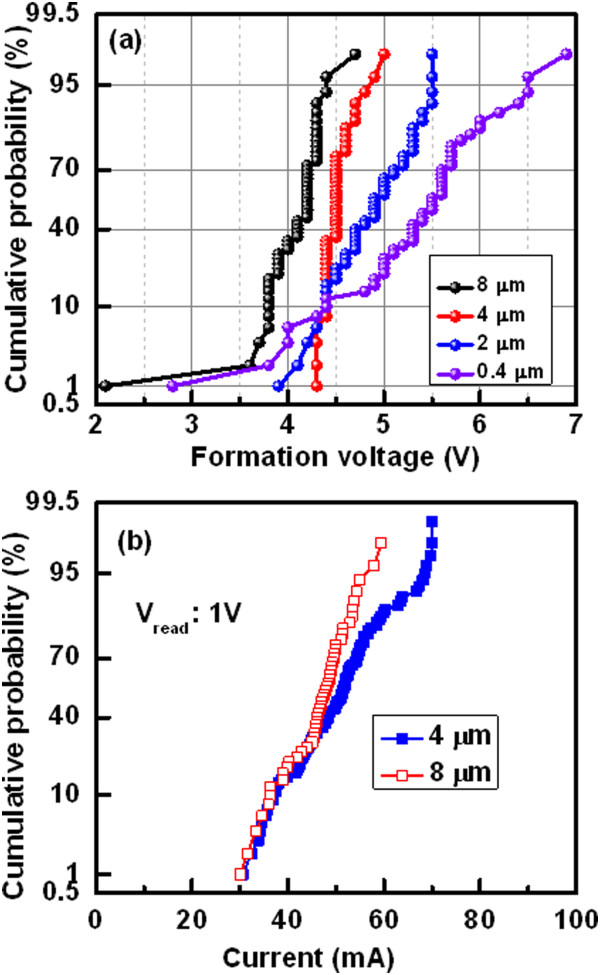
Figure 3.

Statistical distribution of formation voltage and current of the Cu pillars. (a) Formation voltage increases with decreasing device area which suggests the higher Cu diffusion rate for large size devices. (b) Uniform current distribution at LRS of larger device sizes implies the probability of similar conduction path of the Cu pillars.
