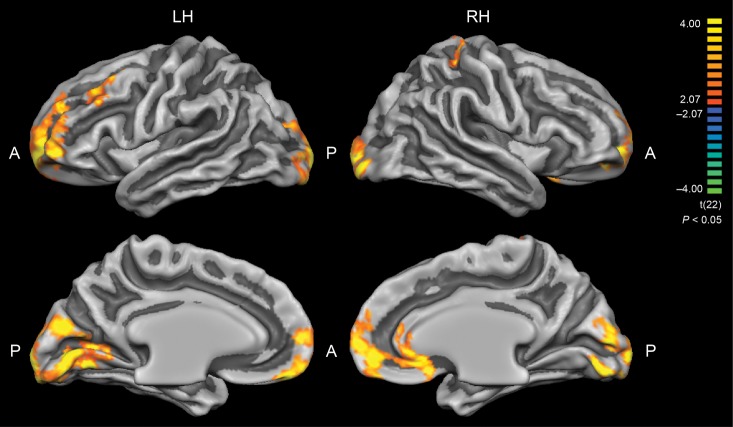
Figure 1.
Group differences in cortical thickness (EB > SC). Results are shown at P < 0.05, corrected by cluster size. Color scale codes t values. LH, left hemisphere; RH, right hemisphere; A, anterior; P, posterior. Occipital and frontal areas in EB were significantly thicker than in SC subjects (see Table 2).

