
Figure 3.
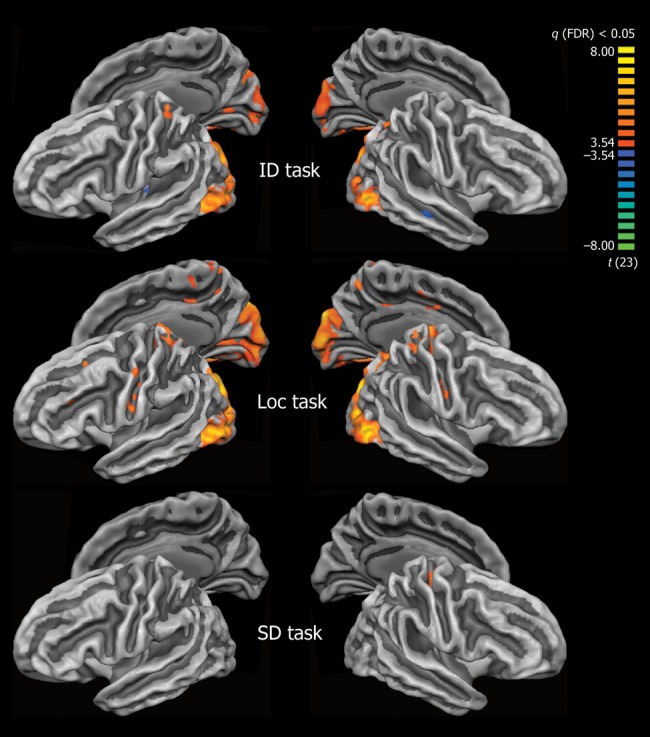
Group differences in cortical functional activation (EB > SC) during Identification versus Rest (ID), Localization versus Rest (Loc), and Sound Detection versus Rest (SD) tasks. Group differences are shown at P < 0.05, FDR-corrected. Color scale codes t values. ID and Loc auditory one-back tasks, but not SD, produce stronger activation in the occipital cortex in EB compared with SC.