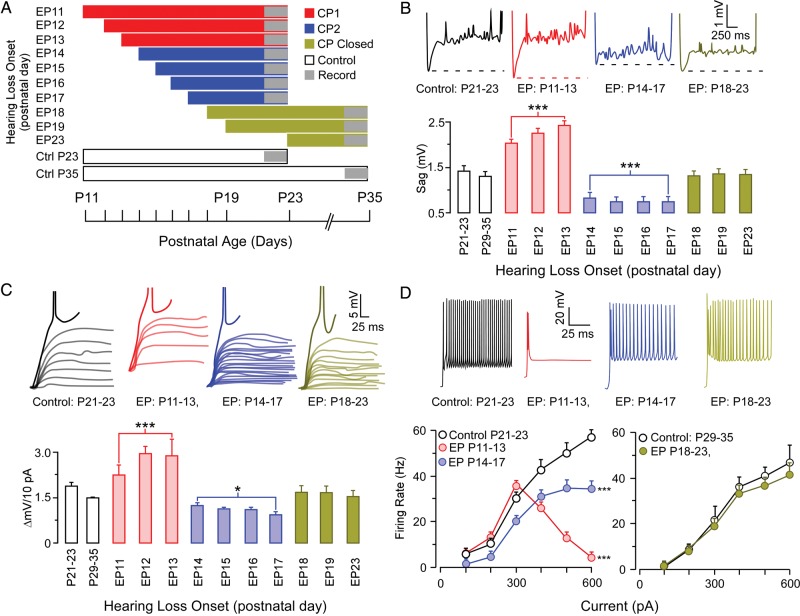
Figure 3.
Specific membrane properties display a CP for EP onset for both P11 to P13 and P14 to P17. (A) A schematic illustrating experimental design to investigate the age of hearing loss onset. (B) Top, representative example traces of the effect of EP between P11 and P23 on the membrane response to hyperpolarizing current injection of −100 pA/1500 ms. Bottom, bar graph shows the 2 CPs of development for depolarizing sag emanating after peak hyperpolarization. (C) Top, Representative traces of the effect of earplugging between P11 and P23 on the response to depolarizing current injection between resting potential and action potential threshold. Bottom, bar graph shows the 2 CPs of development for membrane depolarization in response to a +10 pA current step. (D) Top, representative traces of current-evoked discharge in response to depolarizing current injection of 600 pA. Bottom, Line plots displaying the impact of earplugging from P11 to P13 (red) and P14 to P17 (blue) on firing rates (left), and the impact of earplugging between P18 and P23 on firing rates (right). *P < 0.05, **P < 0.01, ***P < 0.001.

