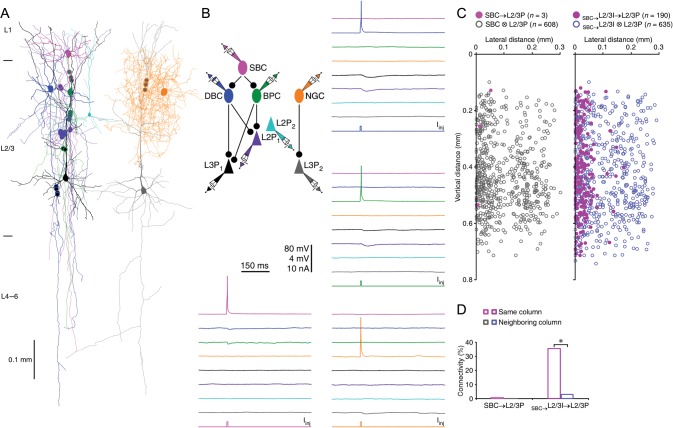
Figure 3.
SBC → L2/3 interneuronal circuits inhibit L2/3 pyramidal neurons within single columns. (A) Reconstruction of L1 SBC (pink), L2 BPC (dark green), L2 DBC (blue), and multiple L2/3 pyramidal neurons (cyan, purple and black) in the same column, and L2 NGC (brown) and L3 pyramidal neuron (gray) in a neighboring column recorded simultaneously from an acute cortical slice. The double colored dots indicate the putative synaptic contacts based on anatomical reconstruction. (B) Single action potentials elicited in presynaptic SBC evoked uIPSPs in postsynaptic BPC and DBC, those in presynaptic BPC and DBC evoked uIPSPs in 2 postsynaptic L2/3 pyramidal neurons (purple and black), and those in presynaptic NGC evoked uIPSPs in postsynaptic L3 pyramidal neuron (gray). The schematic drawing shows symbolically the synaptic connections. Scale bars apply to all recording traces with 80 and 4 mV bars applied to traces with and without action potentials, respectively. (C) The plots show the relative position of L2/3 pyramidal neurons to SBCs and connectivity between SBCs or L2/3 interneurons innervated by SBCs and L2/3 pyramidal neurons. Note the origin of X and Y axes indicating the soma location of SBCs and the pia, filled and empty dots representing connected and unconnected neurons, respectively, and the region with reduced cell density correlating roughly with the border of columns. (D) Values for the connectivity of SBC → L2/3P (SBC → L2/3PSame column: 0.9%, n = 3 of 353 tested connections; SBC → L2/3PNeighboring column: 0.0%, n = 0 of 258 tested connections; χ2 = 2.203; P = 0.14) and SBC→L2/3I → L2/3P (SBC→L2/3I → L2/3PSame column: 35.3%, n = 190 of 530 tested connections; SBC→L2/3I → L2/3PNeighboring column: 2.7%, n = 8 of 294 tested connections; χ2 = 111.095; P < 0.0005). Asterisks indicate P < 0.05 (χ2-tests).

