Fig. 1.—

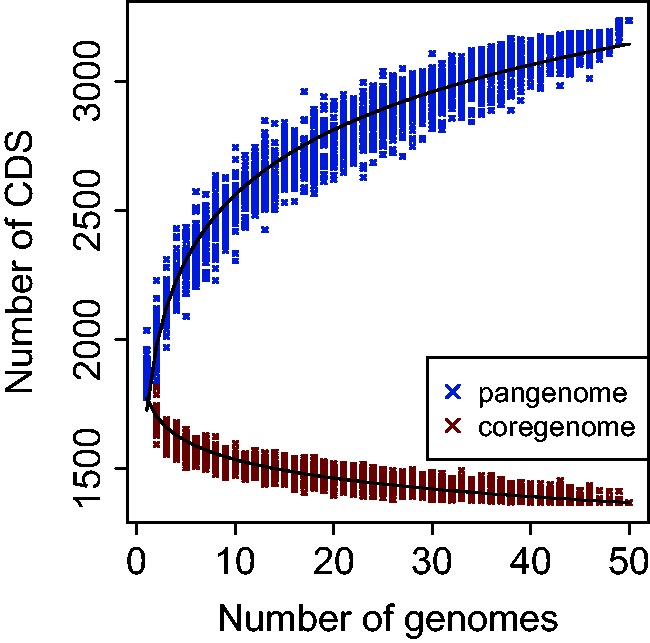
Progression of the core and pangenome of O. oeni. The progression on the composition of the core (red) and pangenome (blue) of O. oeni was computed by adding genomes one by one and iterating the process until reaching the 50 genomes.

Progression of the core and pangenome of O. oeni. The progression on the composition of the core (red) and pangenome (blue) of O. oeni was computed by adding genomes one by one and iterating the process until reaching the 50 genomes.