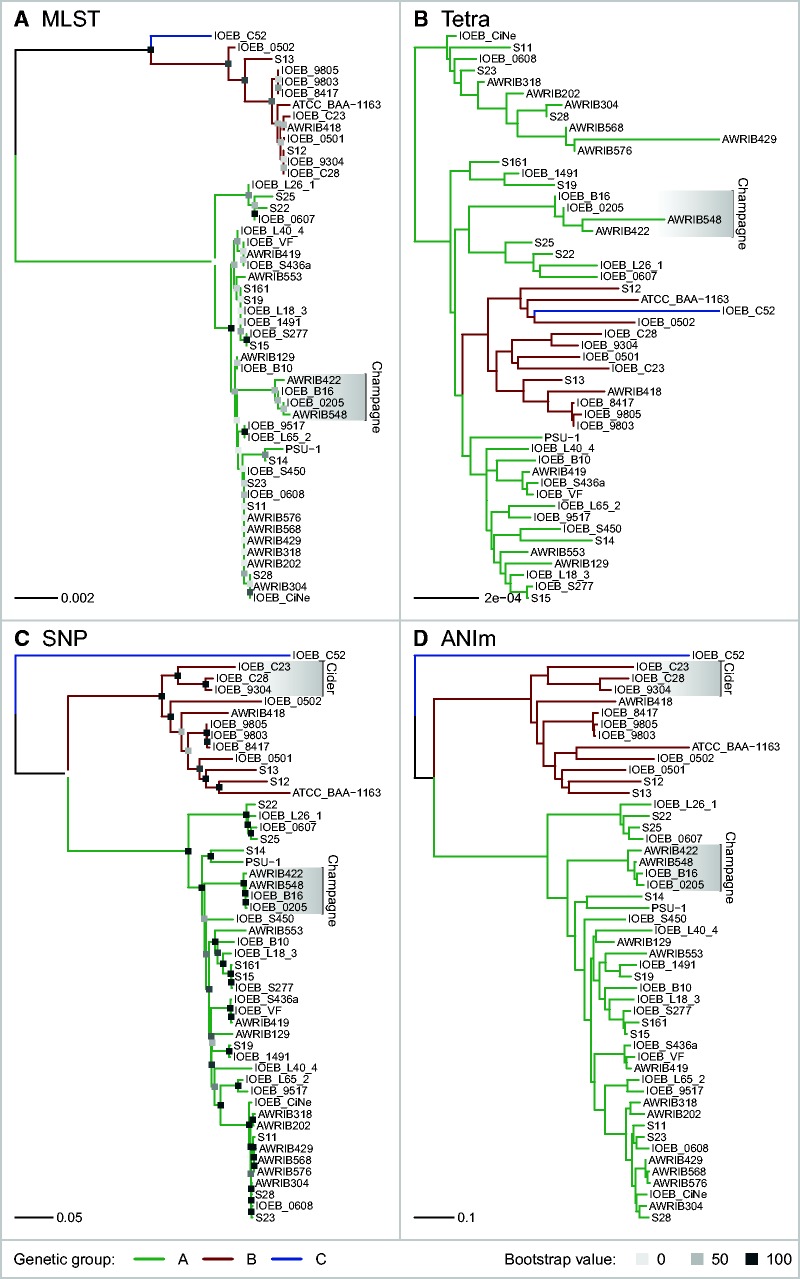
Fig. 2.—
Phylogenetic and phylogenomic reconstructions of O. oeni by four different methods. Phylogenetic reconstruction by MLST was compared against phylogenomic reconstructions by Tetra, SNP, and ANIm. When possible, bootstrap values were calculated by doing 1,000 iterations (values indicated in bottom legend). Major genetic groups are indicated as in the legend. Strains coming from the same product (champagne, cider) are indicated when they form a single cluster.

