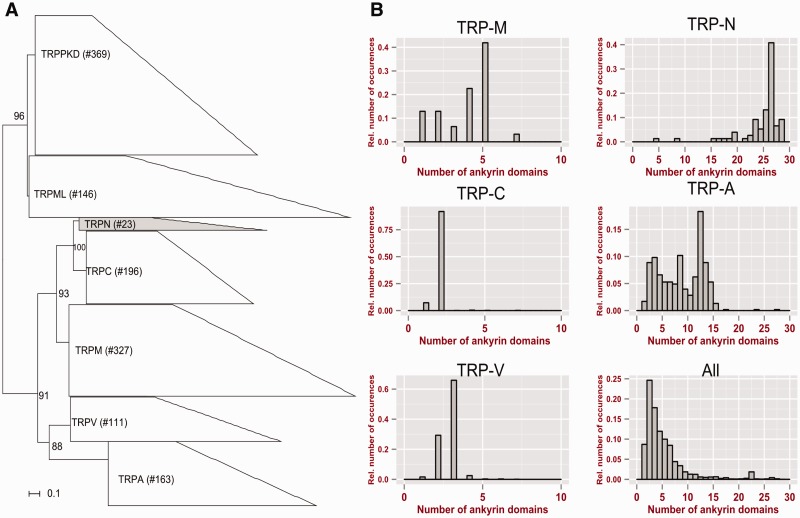
Fig. 1.—
Phylogeny of TRP protein families (A) and distributions of ankyrin domains in TRP proteins (B): Numbers at nodes indicate bootstrap supports and size of the polygons scales to the size of the families across all used genomes (see Materials and Methods for details). The bar plots in (B) show the distribution of ankyrin domains in proteins of the respective TRP families. “All” refers to all proteins, including all TRP proteins, from GenBank with at least one ankyrin domain. The bar plots are based on data from GenBank only and do not include our manually corrected gene models.

