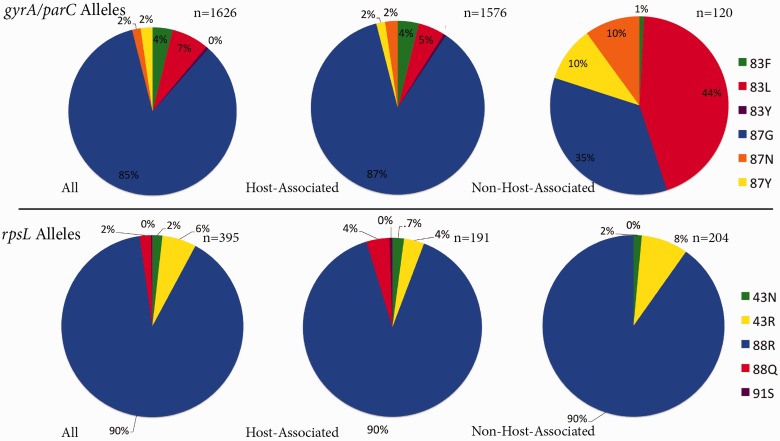
Fig. 2.—
Breakdown of quinolone and streptomycin TRAs among sequences carrying a TRA. Depicted are three pie charts for each antibiotic class, representing the distribution of TRAs within all environments, host-associated environments, and non host-associated environments. n denotes the total number of sequences with TRAs in each group.

