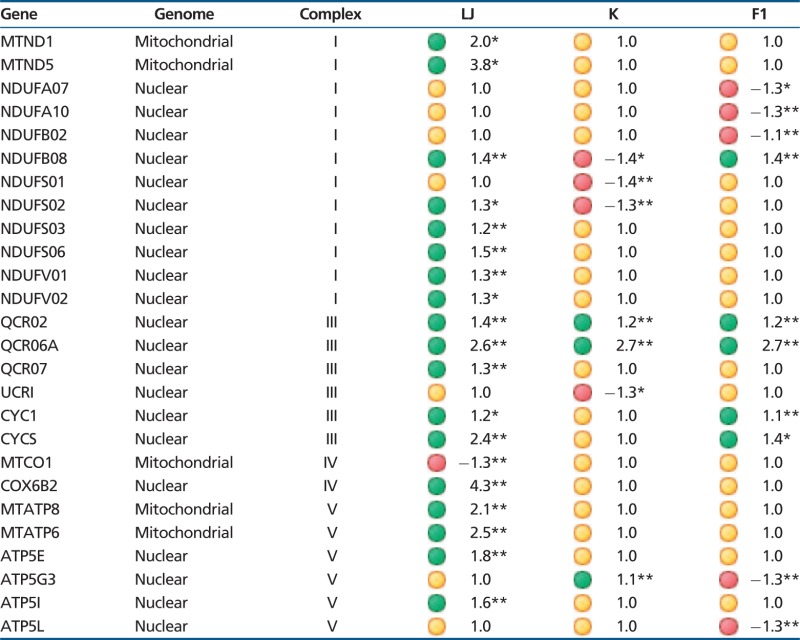
Table 2.
Summary of Significantly Expressed Genes among Strains
 |
Note.—Numbers indicate fold difference between the two treatments. Green dots represent significantly upregulated genes, red significantly downregulated, and yellow not significantly different among groups.
* P < 0.01; **P < 0.001.
