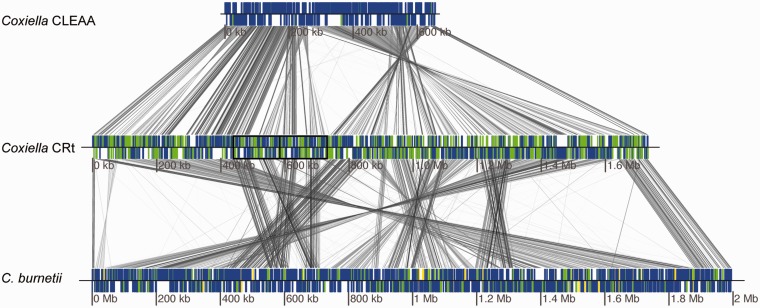
Fig. 2.—
Genome comparison of CLEAA, CRt, and C. burnetii. Blue boxes depict protein-coding genes, green boxes represent pseudogenes, and yellow boxes indicate transposases. The regions framed in black indicate the position of the large duplicated region in CRt. Similarity between genome is shown by the gray lines, where a darker shade indicates higher similar.

