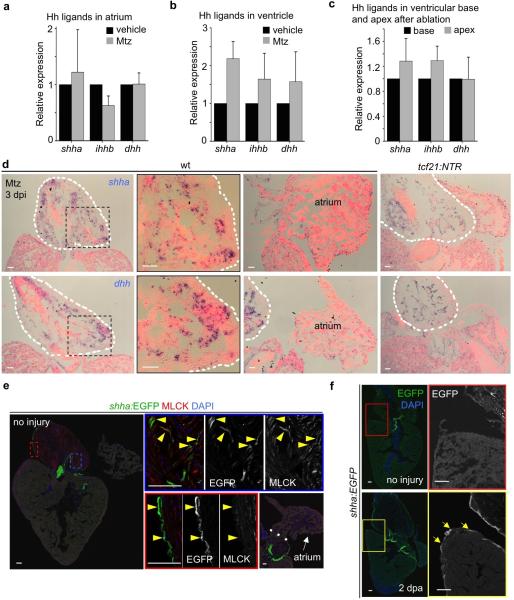
Extended Data Figure 10. Hedgehog ligand expression.
a-c, Quantitative RT-PCR revealing shha, ihhb and dhh expression in atrium (a) or ventricle (b) in uninjured hearts and 3 days post-ablation, or in separated ventricular basal (the basal third of the chamber) and apical (the apical third) tissue after ablation (c). Three separate quantitative RT-PCR experiments on pooled tissues were performed, using a total of 90 zebrafish for (a) and (b) experiments, and another 90 fish for (c). shhb and ihha were not detected in these tissues. d, In situ hybridization (ISH) for shha or dhh in wild-type (wt) or tcf21:NTR clutchmate hearts at 3 days post Mtz treatment, indicating expression in outflow tract (OFT) but not ventricle or atrium. OFT of uninjured and epicardially ablated hearts showed comparable shha and dhh signals by ISH, a qualitative/semi-quantitative assay. e, Section of adult shha:EGFP heart, indicating fluorescence in outflow tract tissues. Smooth muscle cells (MLCK, red) and epicardial cells (outer layer) in outflow tract showed clear EGFP signals, while there is no obvious EGFP fluorescence in ventricle and atrium. Valve mesenchyme also displays EGFP fluorescence. Arrowheads, EGFP signals in smooth muscle cells and epicardium. f, Ventricular resection induces shha:EGFP fluorescence in the basal ventricular epicardium at 2 dpa. Arrows, ventricular epicardial fluorescence. White dashed line in (d, e), outflow tract (d) or atrioventricular junction (e). Boxed areas in (d-f), magnified views. Scale bars, 50 μm. Error bars, s.d.

