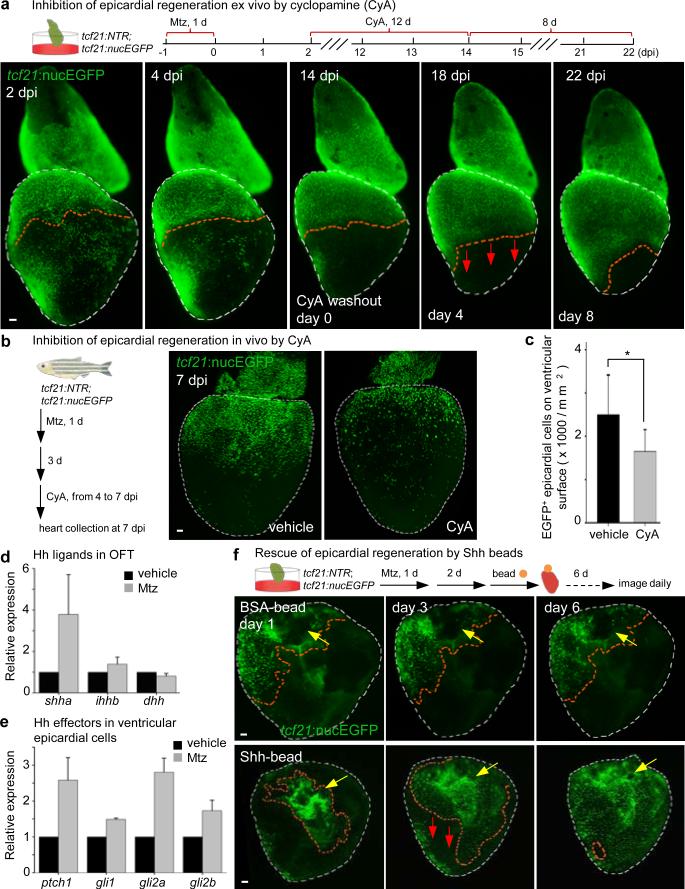
Figure 4. Hedgehog signaling controls epicardial regeneration.
a, (Top) Experimental schematic. (Bottom) CyA arrested regeneration while present (n = 7; all samples), and regeneration initiated (arrows) after CyA removal (6 of 7 ventricles). b, tcf21:NTR; tcf21:nucEGFP adults were incubated with Mtz and randomly separated into two groups for treatment with CyA or vehicle. c, Quantified tcf21:nucEGFP+ epicardial cells from experiments in (b). *P < 0.05; Student's two-tailed t-test; n = 13 (vehicle) and 12 (CyA). d, Quantitative RT-PCR detecting shha and ihhb expression in outflow tract after epicardial ablation (3 dpi), from 3 separate experiments on pooled tissues using 90 total zebrafish. e, Quantitative RT-PCR of FACS-purified ventricular epicardial cells showed increased ptch1 and gli2a expression after epicardial ablation (7 dpi), from 2 separate experiments using 209 zebrafish. f, (Top) BSA- or recombinant Shh-soaked beads were grafted to the base of epicardially ablated ventricles 2 days after 24 hours Mtz treatment. (Bottom) Shh-beads stimulated one-half or greater coverage (red arrows) in 9 of 32 ventricles, whereas BSA-beads (middle) did not (0 of 27). Yellow arrows, transplanted beads. Red dashed lines in (a, f), epicardium or epicardial leading edge. White dashed lines in (a, f), ventricle. Scale bars, 50 μm. Error bars, s.d.

