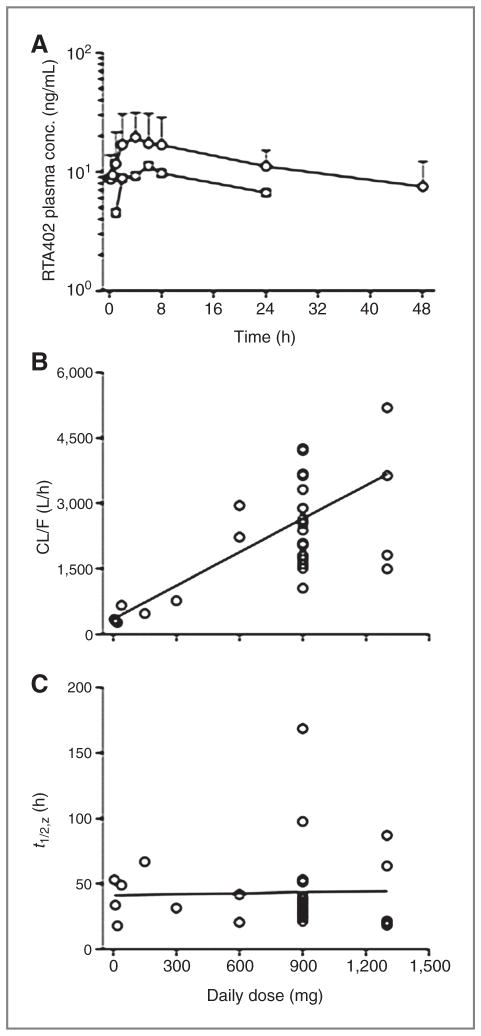
Figure 1.
Pharmacokinetics of bardoxolone methyl. A, mean plasma concentration-time profiles for the first (circles) and last (squares) dose of bardoxolone methyl in the cohort of patients receiving 900 mg/d. Error bars depict the SD of the mean concentration of bardoxolone methyl in plasma for the day 21 dose. B, relationship between the apparent oral clearance (CL/F) of bardoxolone methyl and dose. C, relationship between the biological half-life (t1/2,z) of bardoxolone methyl and dose. B and C, data points are the observed values in individual patients and the solid lines were generated by linear regression analysis of the data.

