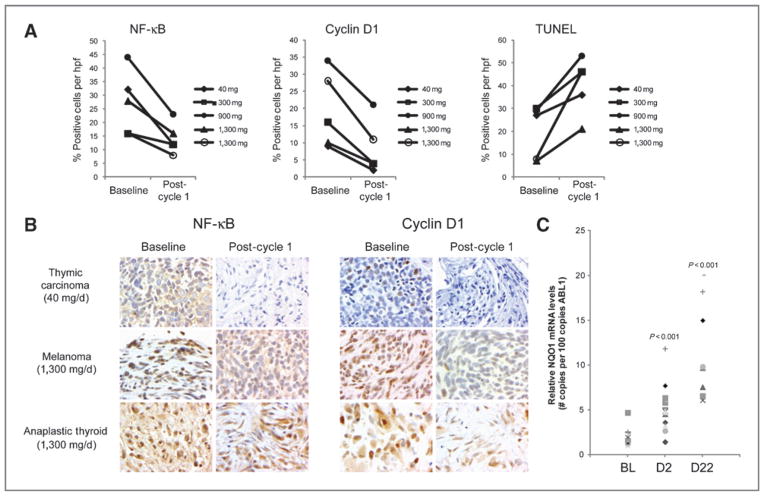
Figure 2.
Pharmacodynamics of bardoxolone methyl. A, levels of NF-κB, cyclin D1, and TUNEL activity were monitored by immunohistochemistry in core biopsies from consenting patients. The average number of positively staining tumor cells per hpf at baseline and after 1 cycle of treatment is shown for 5 patients. The dose of bardoxolone methyl each patient received is indicated. B, representative images of NF-κB and cyclin D1 staining in tumor biopsies from 3 patients. C, NQO1 transcript levels were monitored using qPCR in PBMCs isolated from patients at baseline (BL), day 2 (D2), and day 22 (D22). P-values were determined using the Student’s t-test and indicate statistical significance relative to baseline (BL).

