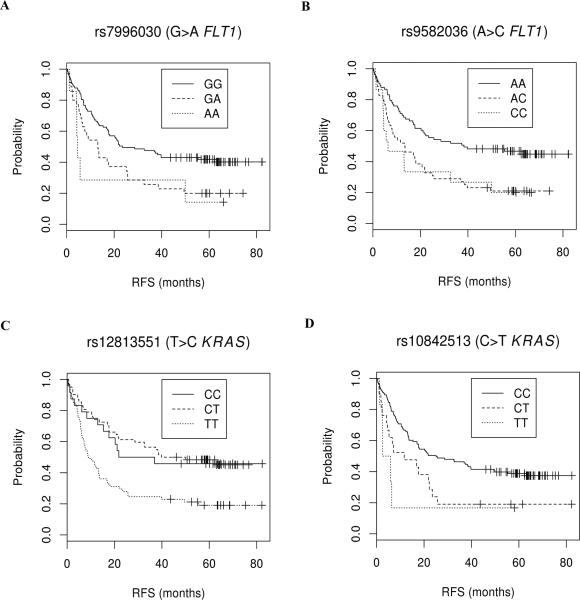
Fig. 1. Kaplan-Meier plots of significant SNP-RFS associations after false discovery rate (FDR) correction (q<0.05) in initial cohort.
Symbols denote censored points. (A) rs7996030: median RFS is 11.1 (95% CI, 5.8 to 25.7) and 23.5 (17.7-NR) months for patients with GA+AA and GG genotypes. (B) rs9582036: median RFS is 13.1 (7.2 to 20.7) and 38.3 (21.1 to NR) months for patients with CC+AC and AA genotypes, respectively. (C) rs12813551: this plot is also representative of rs10505980 due to the high LD with rs12813551. Median RFS is 39.2 (21.8 to NR) and 9.1 (7.0 to 16.8) for patients with CC+TC and TT genotypes, respectively. (D) rs10842513: median RFS is 6.6 (4.6 to 22.2) and 25.1 (17.1 to 49.9) months for patients with CC+TC and TT genotypes, respectively. While these results are for associations adjusted for stage, the plots are for unadjusted data.

